Fig. 6
Download original image
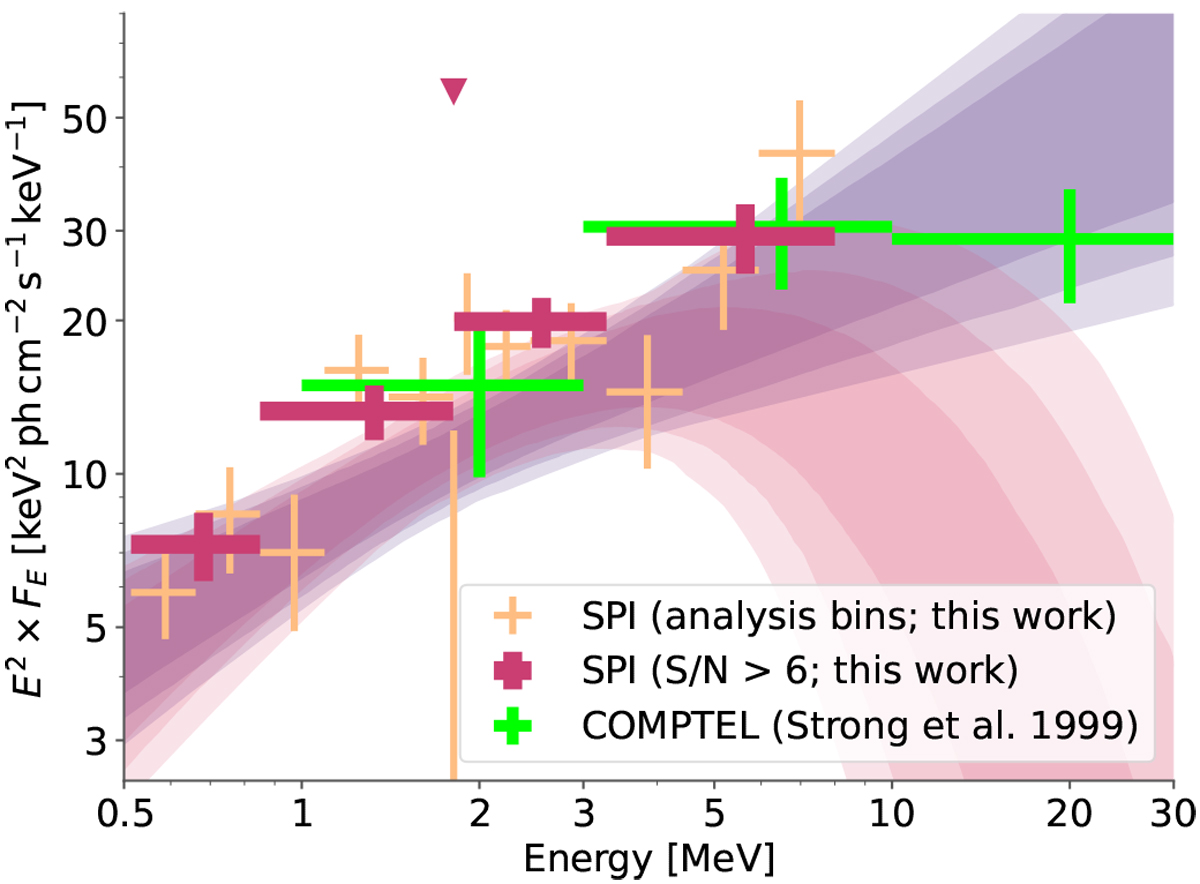
Spectrum of the analysed region between 0.5 and 8 MeV. The orange data points show the extracted fluxes from the energy-dependent IC template δ1 = δ2 = 0.5, and the fuchsia points a re-binning to a minimum signal-to-noise ratio of 6. The fitted power-law spectrum (F0.5–8.0 = (5.7 ± 0.8) × 10−8 ergcm2 s−1 α = −1.39 ± 0.09) is shown with its 68.3, 95.4, and 99.7 percentile bands in violet, and the fitted cutoff power law with EC = 4.9 ± 1.4 MeV in red. We compare the fluxes of this work with historic measurements by COMPTEL (green; Strong et al. 1999).
Current usage metrics show cumulative count of Article Views (full-text article views including HTML views, PDF and ePub downloads, according to the available data) and Abstracts Views on Vision4Press platform.
Data correspond to usage on the plateform after 2015. The current usage metrics is available 48-96 hours after online publication and is updated daily on week days.
Initial download of the metrics may take a while.