Fig. 5
Download original image
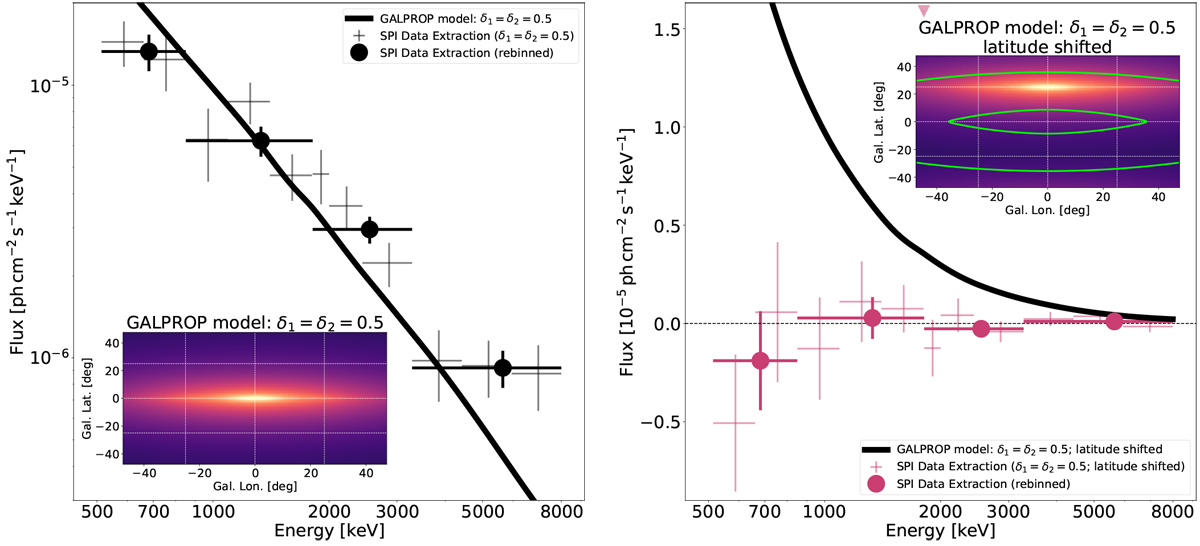
Comparison of fitted IC source fluxes with GALPROP model δ1 =δ2 = 0.5 (left) and the same template maps but shifted in latitude by +25° (right). The expected spectrum is shown as a black curve and the extracted fluxes with crosses. The insets show a representative template map, with the unshifted map as contours in the right inset. No excess is found for the shifted templates, consolidating the signal found from the Galactic plane.
Current usage metrics show cumulative count of Article Views (full-text article views including HTML views, PDF and ePub downloads, according to the available data) and Abstracts Views on Vision4Press platform.
Data correspond to usage on the plateform after 2015. The current usage metrics is available 48-96 hours after online publication and is updated daily on week days.
Initial download of the metrics may take a while.