Fig. 4
Download original image
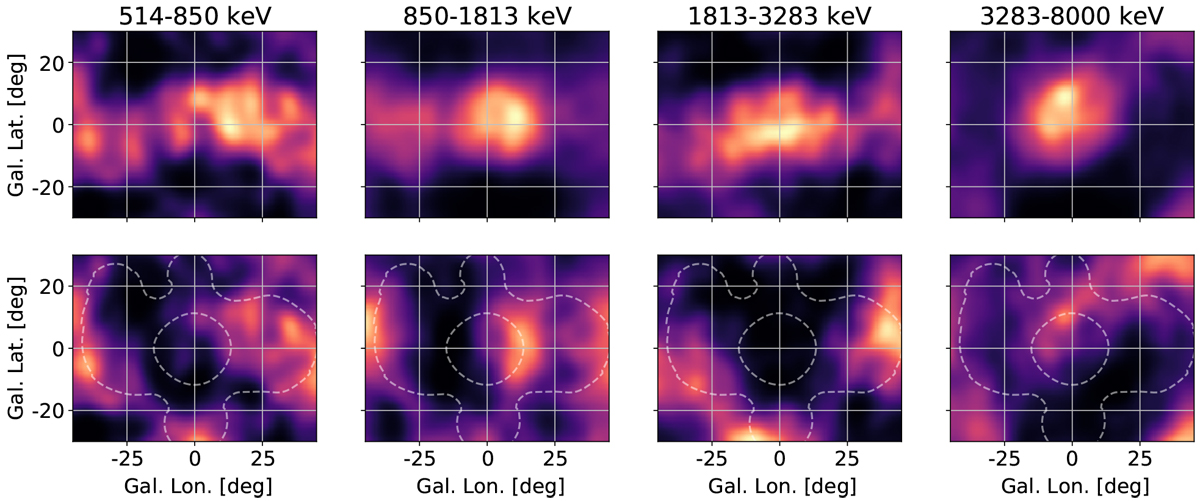
Count residuals projected back onto the sky as a function of energy. Top: background-only fits with consistent positive residuals along the Galactic plane and centre. Bottom: background plus IC template map fits, with the exposure map indicated. Shown are levels where the exposure drops to 50 and 10% of the maximum, respectively.
Current usage metrics show cumulative count of Article Views (full-text article views including HTML views, PDF and ePub downloads, according to the available data) and Abstracts Views on Vision4Press platform.
Data correspond to usage on the plateform after 2015. The current usage metrics is available 48-96 hours after online publication and is updated daily on week days.
Initial download of the metrics may take a while.