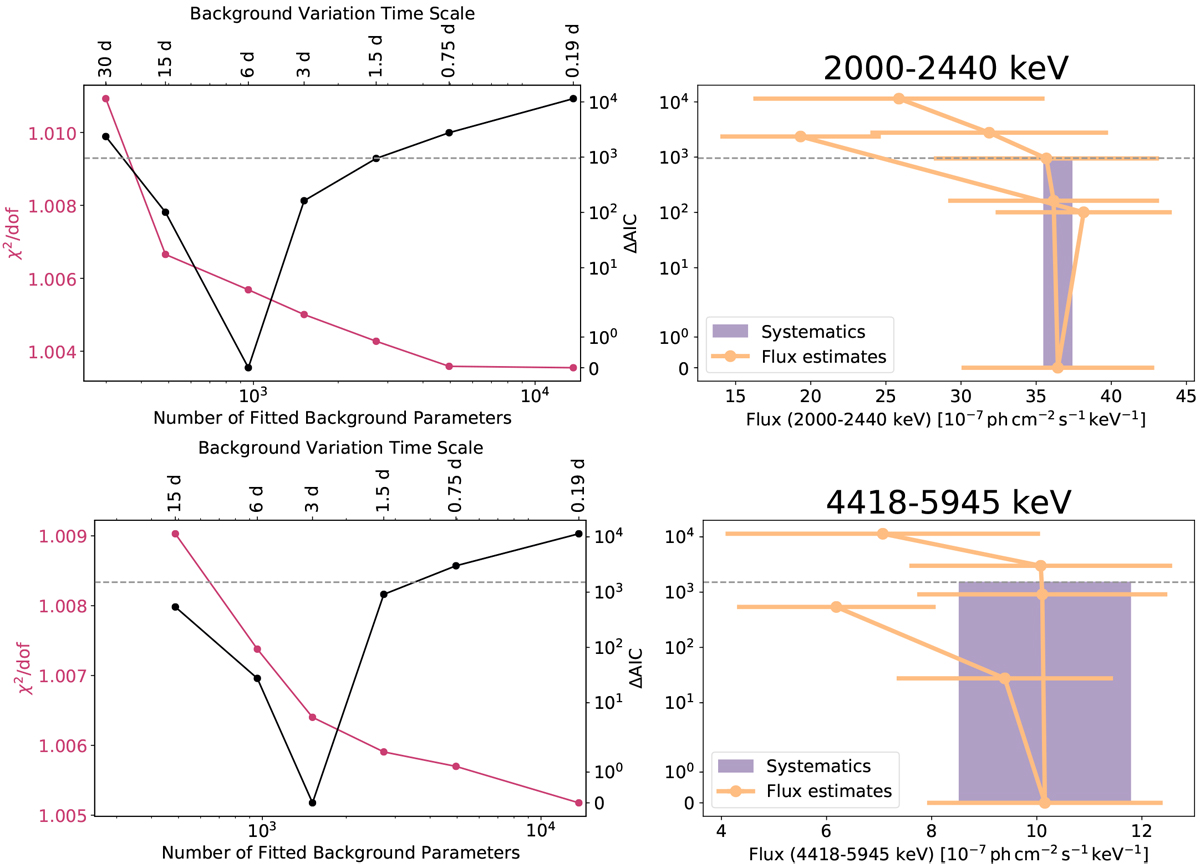
Fig. 3
Download original image
Background variability and systematics for two chosen energy bins, 2000–2440 keV (top, dominated by statistics) and 4418–5945 keV (bottom, statistics and systematics of the same magnitude). Left: scan for optimal background variability timescale as measured with the AIC (right axis), Eq. (1). The optimum is found at timescales of 6 and 3 d, respectively corresponding to two and one INTEGRAL orbits. For comparison, the calculated reduced Pearson χ2 is shown for each tested grid point. Right: corresponding flux estimates and statistical uncertainties (orange). The systematics are estimated from the standard deviation of fluxes whose ΔAIC values are below the number of fitted parameters at optimum AIC (shaded region).
Current usage metrics show cumulative count of Article Views (full-text article views including HTML views, PDF and ePub downloads, according to the available data) and Abstracts Views on Vision4Press platform.
Data correspond to usage on the plateform after 2015. The current usage metrics is available 48-96 hours after online publication and is updated daily on week days.
Initial download of the metrics may take a while.