Fig. 2
Download original image
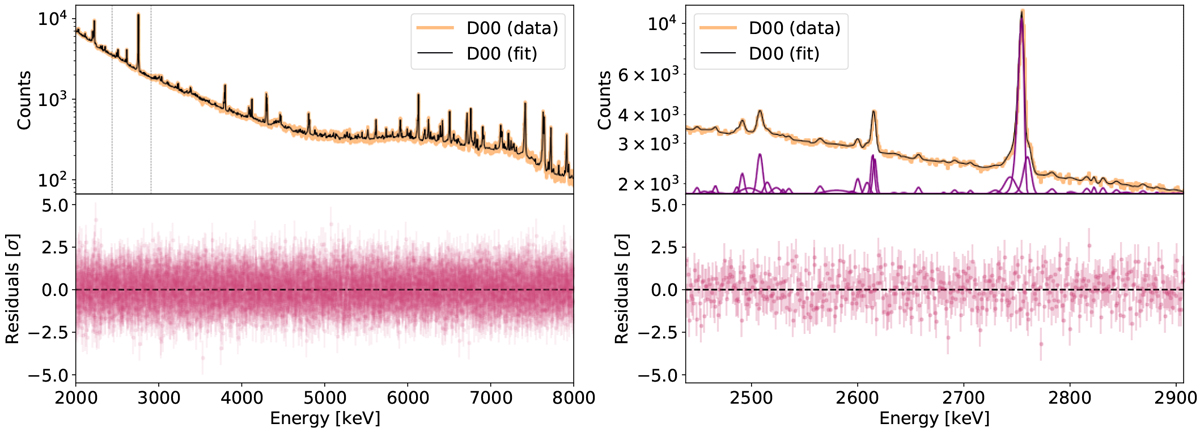
SPI data of one detector (00) between INTEGRAL revolutions 777 and 795 and spectral fits. Left: complete spectrum of SPI’s HE range between 2 and 8 MeV (top) and residuals (bottom). Right: zoomed-in view between 2.4 and 2.9 MeV, with individual lines indicated. The shown normalised residuals scatter around 0.04 with a standard deviation of 0.94 for the 6000 data points indicate a sufficiently well-described background spectrum fit.
Current usage metrics show cumulative count of Article Views (full-text article views including HTML views, PDF and ePub downloads, according to the available data) and Abstracts Views on Vision4Press platform.
Data correspond to usage on the plateform after 2015. The current usage metrics is available 48-96 hours after online publication and is updated daily on week days.
Initial download of the metrics may take a while.