Fig. 15.
Download original image
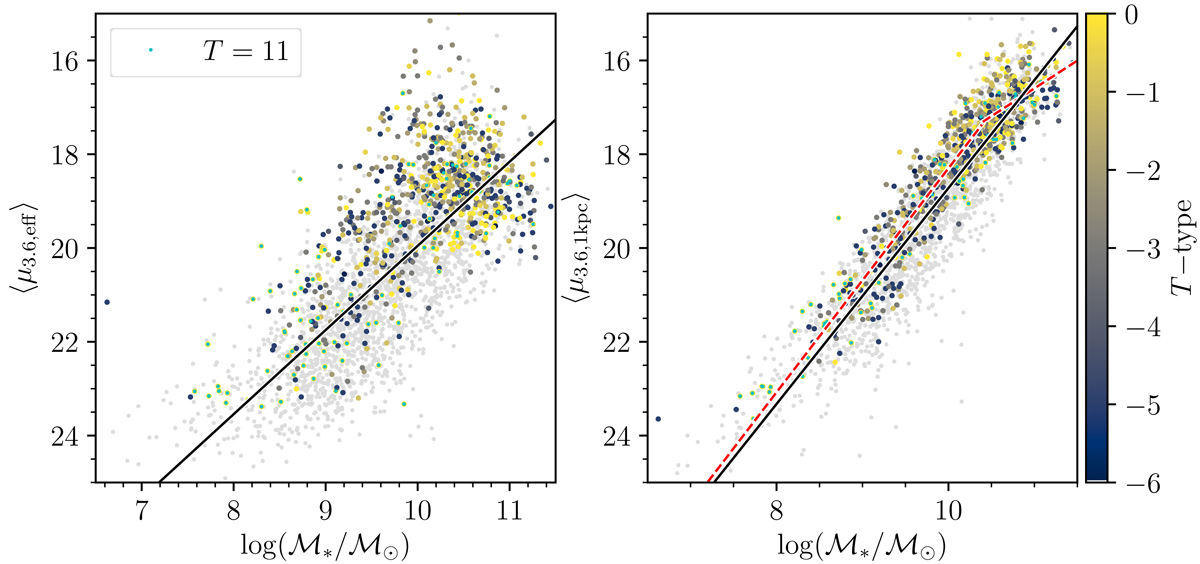
Mean surface brightness within the effective radius (left panel) and within 1 kpc (right panel) vs. stellar mass. The solid black lines in both panels show linear fits to all S4G+ETG galaxies. The dashed red lines in the right panel show fits to only ETGs, separated at log (ℳ*/ℳ⊙) = 10.4 (see text). ETG data points are multicolored, while LTGs are shown in gray.
Current usage metrics show cumulative count of Article Views (full-text article views including HTML views, PDF and ePub downloads, according to the available data) and Abstracts Views on Vision4Press platform.
Data correspond to usage on the plateform after 2015. The current usage metrics is available 48-96 hours after online publication and is updated daily on week days.
Initial download of the metrics may take a while.