Free Access
Fig. 1.
Download original image
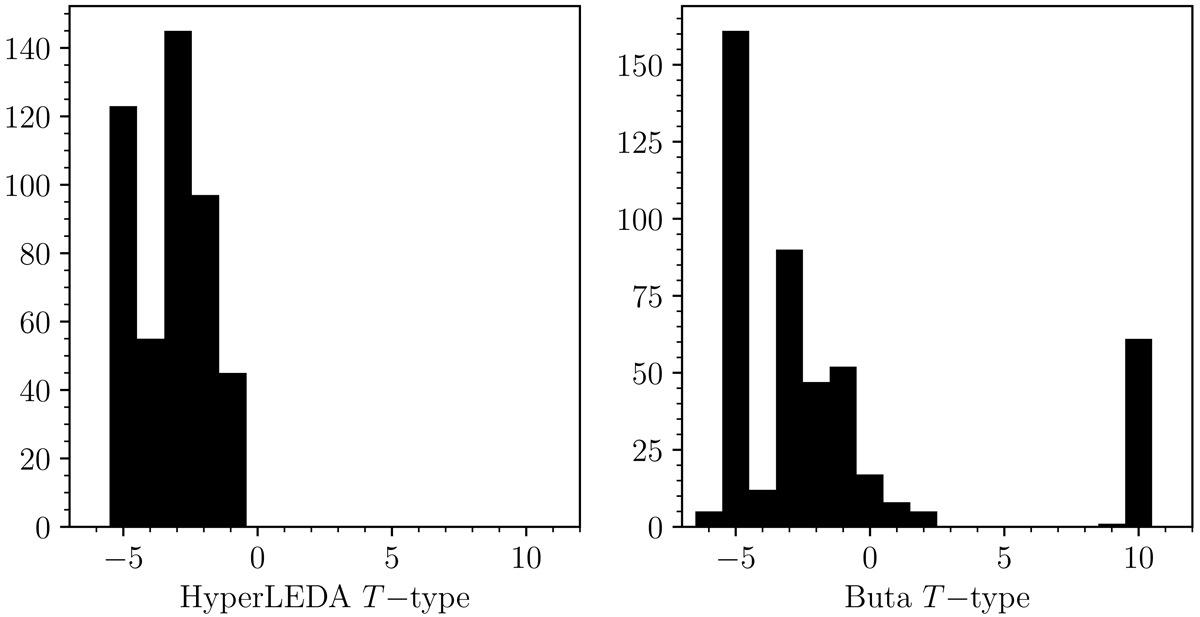
HyperLEDA T-type distribution (left panel) and T-type distribution from 3.6 μm classifications by R. Buta (right panel) for the 465 newly observed ETGs in the S4G+ETG sample. We use the Buta T-types for the remainder of this paper, given their improved accuracy.
Current usage metrics show cumulative count of Article Views (full-text article views including HTML views, PDF and ePub downloads, according to the available data) and Abstracts Views on Vision4Press platform.
Data correspond to usage on the plateform after 2015. The current usage metrics is available 48-96 hours after online publication and is updated daily on week days.
Initial download of the metrics may take a while.