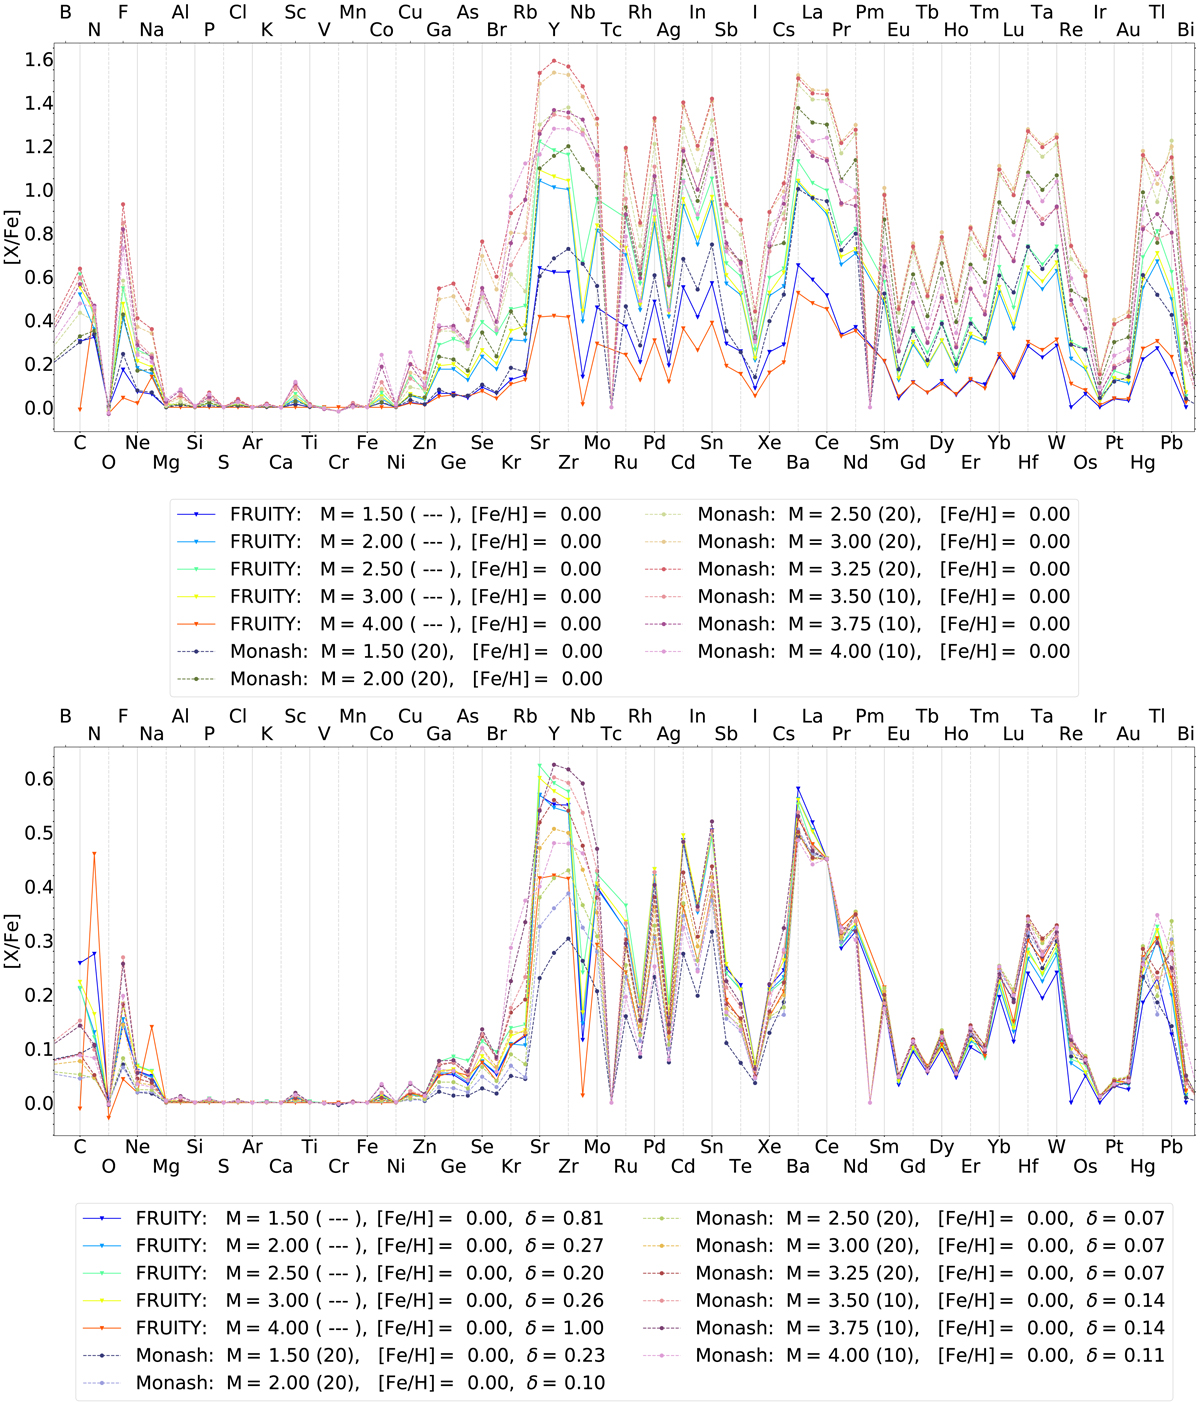
Fig. 4.
Download original image
Example of selected models with standard 13C pocket showing the final surface abundances without applying any dilution (δ = 1 for all models, top panel) and by applying a dilution (bottom panel) such that [Ce/Fe] = 0.451 dex, which is the value produced by the FRUITY 4 M⊙ model. Thus, this model has δ = 1. Specific properties of the FRUITY models are given in parentheses after the mass of each model: ‘---’ indicates the standard models, while ‘TAIL’, ‘rotating’ and ‘rotating TAIL’ models with 60 km s−1 initial rotational velocity are indicated by (ext), (rNN), and (T60), respectively, where NN is the initial rotational velocity in km s−1. The numbers given in parentheses after the mass of each Monash model represent the MPMZ in units of 10−4 M⊙. We note that the high N and Na values shown by the undiluted 4 M⊙ FRUITY model are due to production by the first dredge up, the other models do not show these high values because they are diluted. We also note that the FRUITY Nb and Sm abundances are lower than in the Monash models because 93Zr and 147Pm are not decayed.
Current usage metrics show cumulative count of Article Views (full-text article views including HTML views, PDF and ePub downloads, according to the available data) and Abstracts Views on Vision4Press platform.
Data correspond to usage on the plateform after 2015. The current usage metrics is available 48-96 hours after online publication and is updated daily on week days.
Initial download of the metrics may take a while.