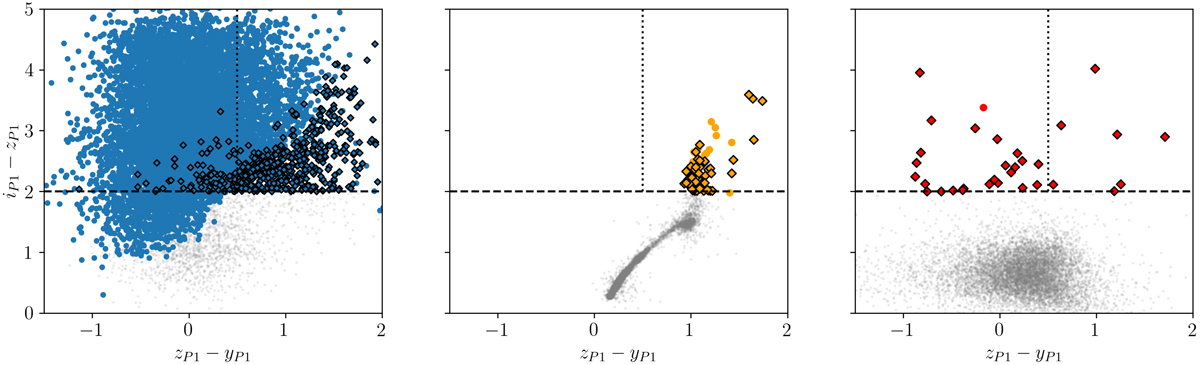
Fig. 6.
Download original image
Distribution of sources in the zP1 − yP1 vs iP1 − zP1 diagram of the test samples of HzQs (left), brown dwarfs (middle), and galaxies (right). Sources not selected with any method are marked in grey. Sources selected with i − z > 2 colour cut (dashed line) but rejected by the probability selection are marked as a diamond shape with a black edge. Notably, the z − y < 0.5 colour cut (dotted line) rejects all brown dwarfs from the test sample, but also a large portion of the simulated quasar sample.
Current usage metrics show cumulative count of Article Views (full-text article views including HTML views, PDF and ePub downloads, according to the available data) and Abstracts Views on Vision4Press platform.
Data correspond to usage on the plateform after 2015. The current usage metrics is available 48-96 hours after online publication and is updated daily on week days.
Initial download of the metrics may take a while.