Fig. 5.
Download original image
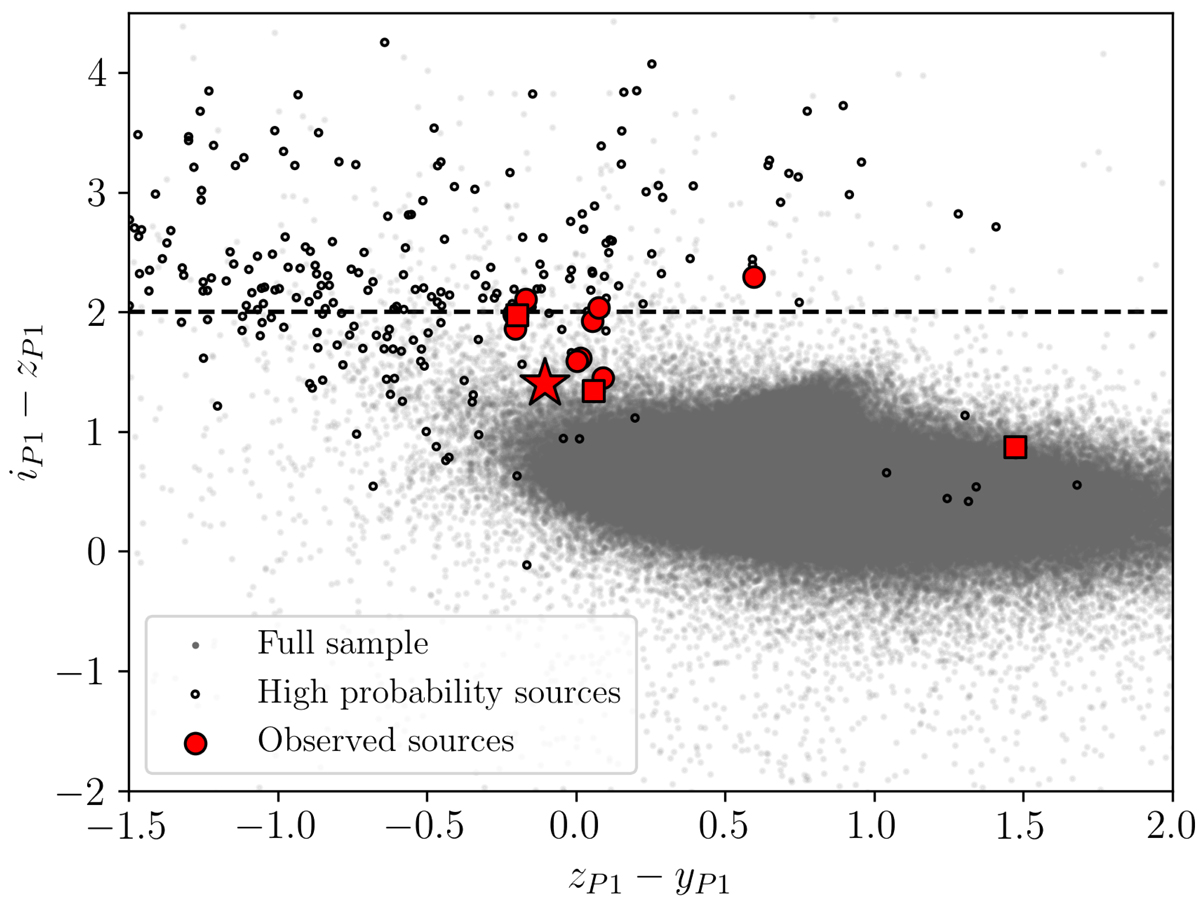
Distribution of sources in the zP1 − yP1 vs iP1 − zP1 diagram of the full PS1 sample (grey points), high-probability HzQs (black circles), and the candidate HzQs selected for spectroscopic follow-up (red circles) and those with a radio detection (red squares). The traditional colour cut at i − z = 2 is marked using the black dashed line, demonstrating that our method assigns a high HzQ probability to several sources that lie below this selection. We also mark P144+50 (red star) in the colour–colour plot, which was discovered using our method at a redshift of z = 5.66, and with i − z = 1.4 lies below the standard photometric selection employed in other studies.
Current usage metrics show cumulative count of Article Views (full-text article views including HTML views, PDF and ePub downloads, according to the available data) and Abstracts Views on Vision4Press platform.
Data correspond to usage on the plateform after 2015. The current usage metrics is available 48-96 hours after online publication and is updated daily on week days.
Initial download of the metrics may take a while.