Fig. 1.
Download original image
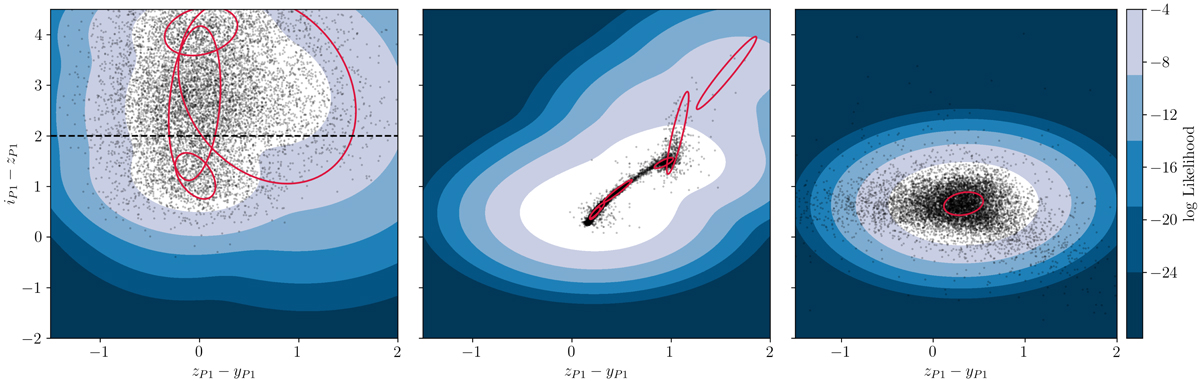
Log likelihood of quasars (left), dwarf stars (middle), and low-redshift galaxies (right) modelled by a Gaussian mixture model in colour space. The red ellipses indicate the 3-sigma extents of the individual deconvolved Gaussians (four components for quasars, six for dwarf stars, and one for galaxies). The quasar likelihoods are assigned using photometry from simulated quasar spectra as highlighted in Sect. 3.1, whereas the photometry for dwarf stars and low-redshift galaxies are taken from their respective reference catalogues, Best et al. (2017) and Williams et al. (2018) (black dots). The dashed line in the left panel marks the commonly defined colour cut at i − z = 2.0.
Current usage metrics show cumulative count of Article Views (full-text article views including HTML views, PDF and ePub downloads, according to the available data) and Abstracts Views on Vision4Press platform.
Data correspond to usage on the plateform after 2015. The current usage metrics is available 48-96 hours after online publication and is updated daily on week days.
Initial download of the metrics may take a while.