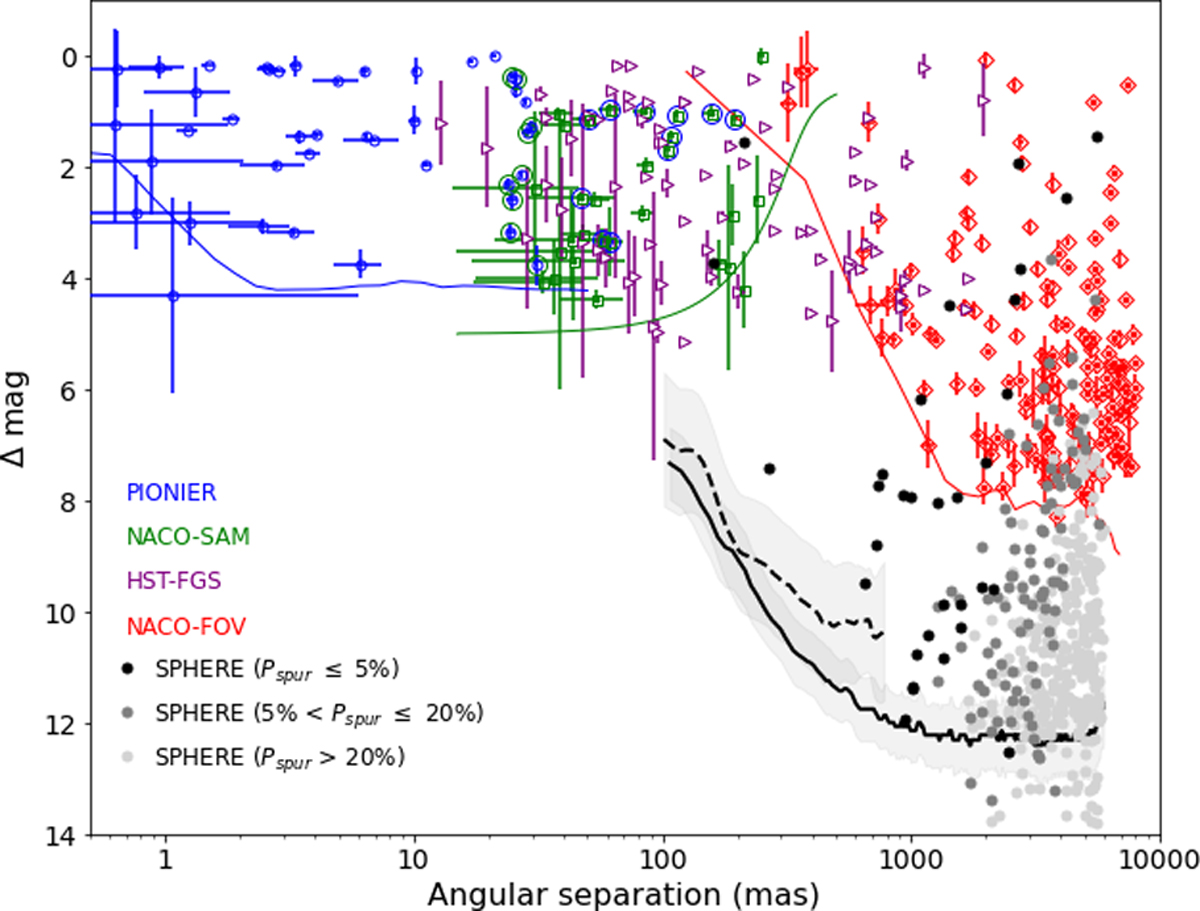
Fig. 12.
Download original image
Δmag vs. separation diagram. The location of the newly discovered sources (black and grey dots), as well as the median IRDIS and IFS contrast limits are compared with the outcome of previous surveys (Sana et al. 2014). Black, grey, and light-grey dots corresponds to sources with Pspur ≤ 5%, 5%< Pspur ≤ 20%, and Pspur > 20%, respectively.
Current usage metrics show cumulative count of Article Views (full-text article views including HTML views, PDF and ePub downloads, according to the available data) and Abstracts Views on Vision4Press platform.
Data correspond to usage on the plateform after 2015. The current usage metrics is available 48-96 hours after online publication and is updated daily on week days.
Initial download of the metrics may take a while.