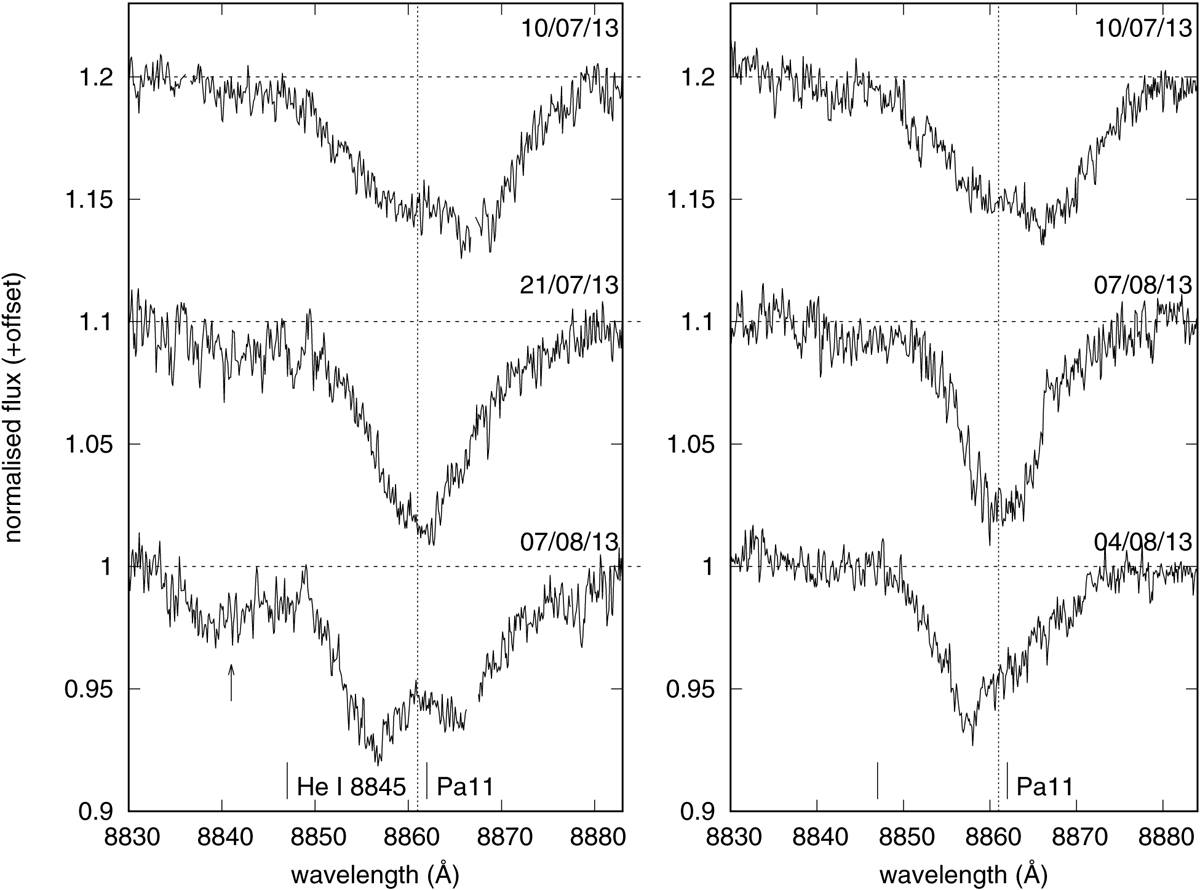
Fig. 14.
Download original image
Montage of the Pa-11 line in W36 (P = 3.18 days, left panel) and W53a (right panel). Horizontal lines represent the continuum level at each epoch, and the vertical line represents the mean Pa-11 RV for stars in Westerlund 1. Spectra have been rebinned and filtered to reduce noise, and gaps indicate sky line removal as described in Sect. 3.2.
Current usage metrics show cumulative count of Article Views (full-text article views including HTML views, PDF and ePub downloads, according to the available data) and Abstracts Views on Vision4Press platform.
Data correspond to usage on the plateform after 2015. The current usage metrics is available 48-96 hours after online publication and is updated daily on week days.
Initial download of the metrics may take a while.