Free Access
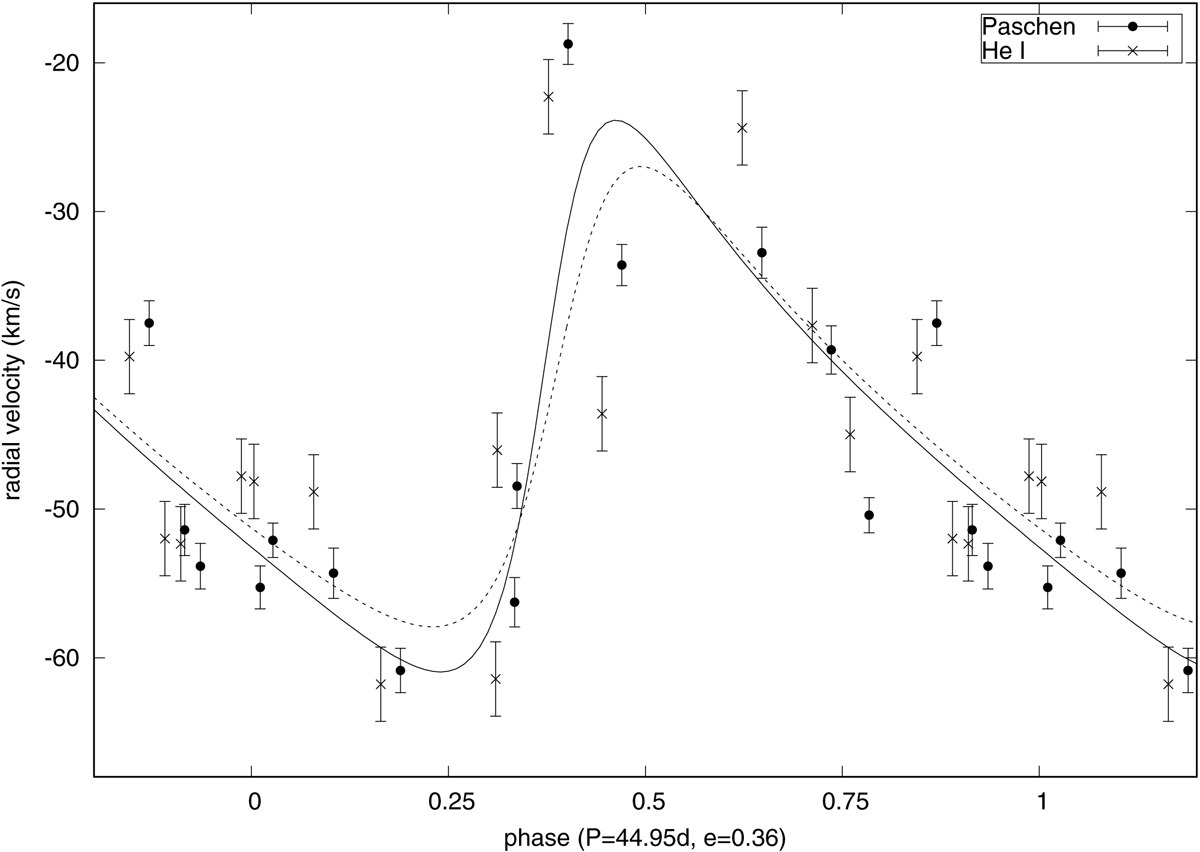
Fig. 13.
Download original image
Candidate RV curves for W2a. The solid line represents a fit to the Paschen series lines, while the dashed line represents an independent fit to He I λλ8583,8845. Scatter around the fit appears to be pulsational in origin.
Current usage metrics show cumulative count of Article Views (full-text article views including HTML views, PDF and ePub downloads, according to the available data) and Abstracts Views on Vision4Press platform.
Data correspond to usage on the plateform after 2015. The current usage metrics is available 48-96 hours after online publication and is updated daily on week days.
Initial download of the metrics may take a while.