Fig. 12.
Download original image
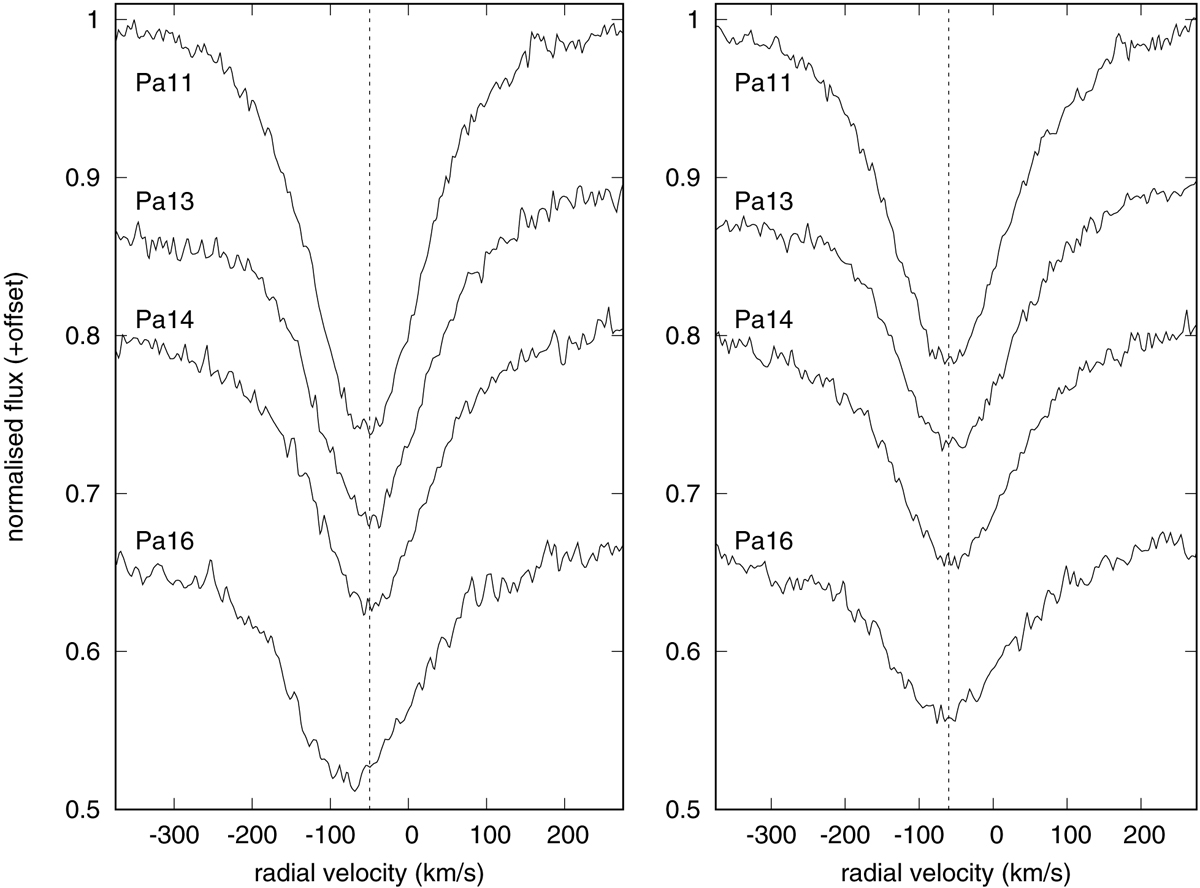
Montage of Paschen series absorption lines in W23a (left panel) and W2a (right panel). Vertical lines mark the average of the Pa-11 and Pa-13−15 lines (Pa-12 is omitted due to the influence of the C2 Phillips (2−0) system). Note the discrepant line centre and greater depth for Pa-16 in W23a due to blending with C III λ8500; this is not seen in W2a or other luminous B supergiants, and implies the existence of an ∼O9 I secondary.
Current usage metrics show cumulative count of Article Views (full-text article views including HTML views, PDF and ePub downloads, according to the available data) and Abstracts Views on Vision4Press platform.
Data correspond to usage on the plateform after 2015. The current usage metrics is available 48-96 hours after online publication and is updated daily on week days.
Initial download of the metrics may take a while.