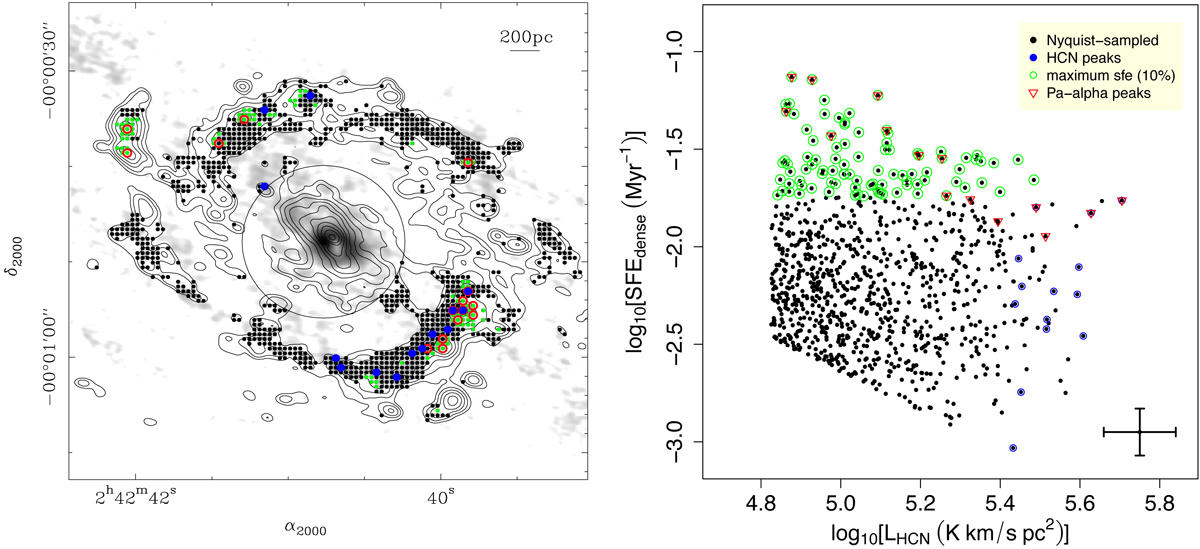
Fig. 9.
Download original image
Distribution of the HCN and Paα peaks and the apertures showing the highest SFEdense in NGC 1068. Left panel: overlay of the HST/NICMOS Paα image (contours) on the HCN(1–0) map (grey scale). The contours and grey scale are the same as in Fig. 4. The set of 56 pc size circular apertures used to extract the fluxes of Paα and HCN(1–0) are colour-coded differently, depending on whether they are centred on HCN peaks (in blue), on Paα peaks (in red), or on the 10% of the apertures showing the highest values of SFEdense (in green). The black dots identify the centres of all the Nyquist-sampled 56 pc size apertures where there are reliable estimates of SFEdense across the SB ring. Right panel: distribution of SFEdense values (in Myr−1-units) as a function of LHCN (in K km s−1 pc2-units) in the SB ring of NGC 1068. Symbols are the same as in left panel. Vertical and horizontal error bars at the lower-right corner of the panel account for the typical uncertainties, which amount to ±0.13 dex and ±0.09 dex, respectively.
Current usage metrics show cumulative count of Article Views (full-text article views including HTML views, PDF and ePub downloads, according to the available data) and Abstracts Views on Vision4Press platform.
Data correspond to usage on the plateform after 2015. The current usage metrics is available 48-96 hours after online publication and is updated daily on week days.
Initial download of the metrics may take a while.