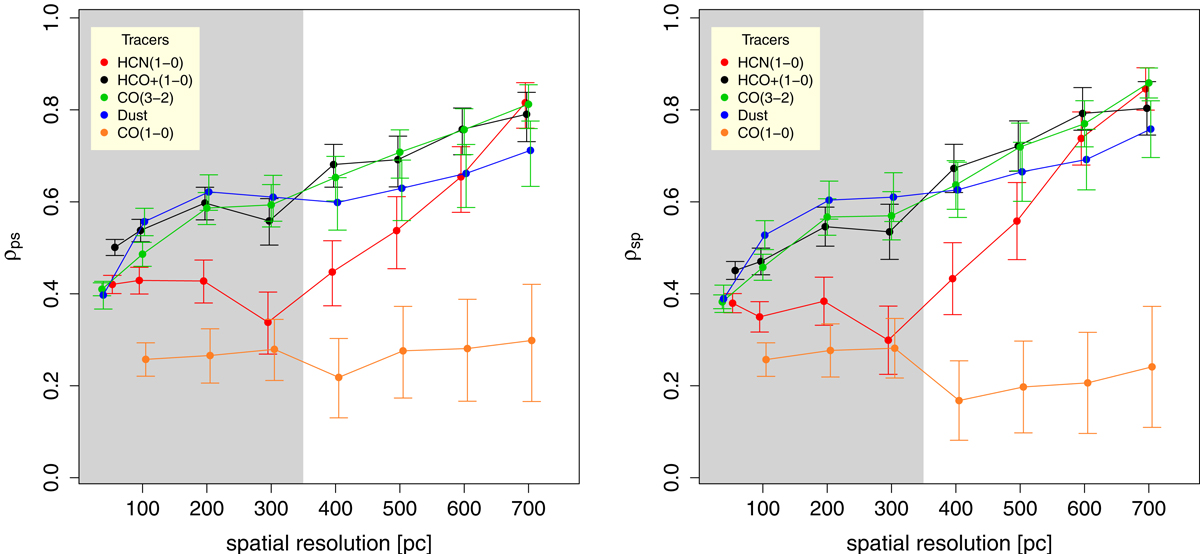
Fig. 6.
Download original image
Pearson and Spearman correlation coefficients (ρps: left panel; ρsp: right panel) of the KS laws derived for the different gas tracers used in this work as a function of the spatial resolution. Error bars represent the 67% confidence interval around the mean values. For spatial scales larger than the range identified by the grey-coloured region (≤350 pc) all the gas tracers (leaving aside CO(1–0)) show statistically significant correlations in their KS laws, defined by p-values < 1% and ρps, ρsp > 0.4.
Current usage metrics show cumulative count of Article Views (full-text article views including HTML views, PDF and ePub downloads, according to the available data) and Abstracts Views on Vision4Press platform.
Data correspond to usage on the plateform after 2015. The current usage metrics is available 48-96 hours after online publication and is updated daily on week days.
Initial download of the metrics may take a while.