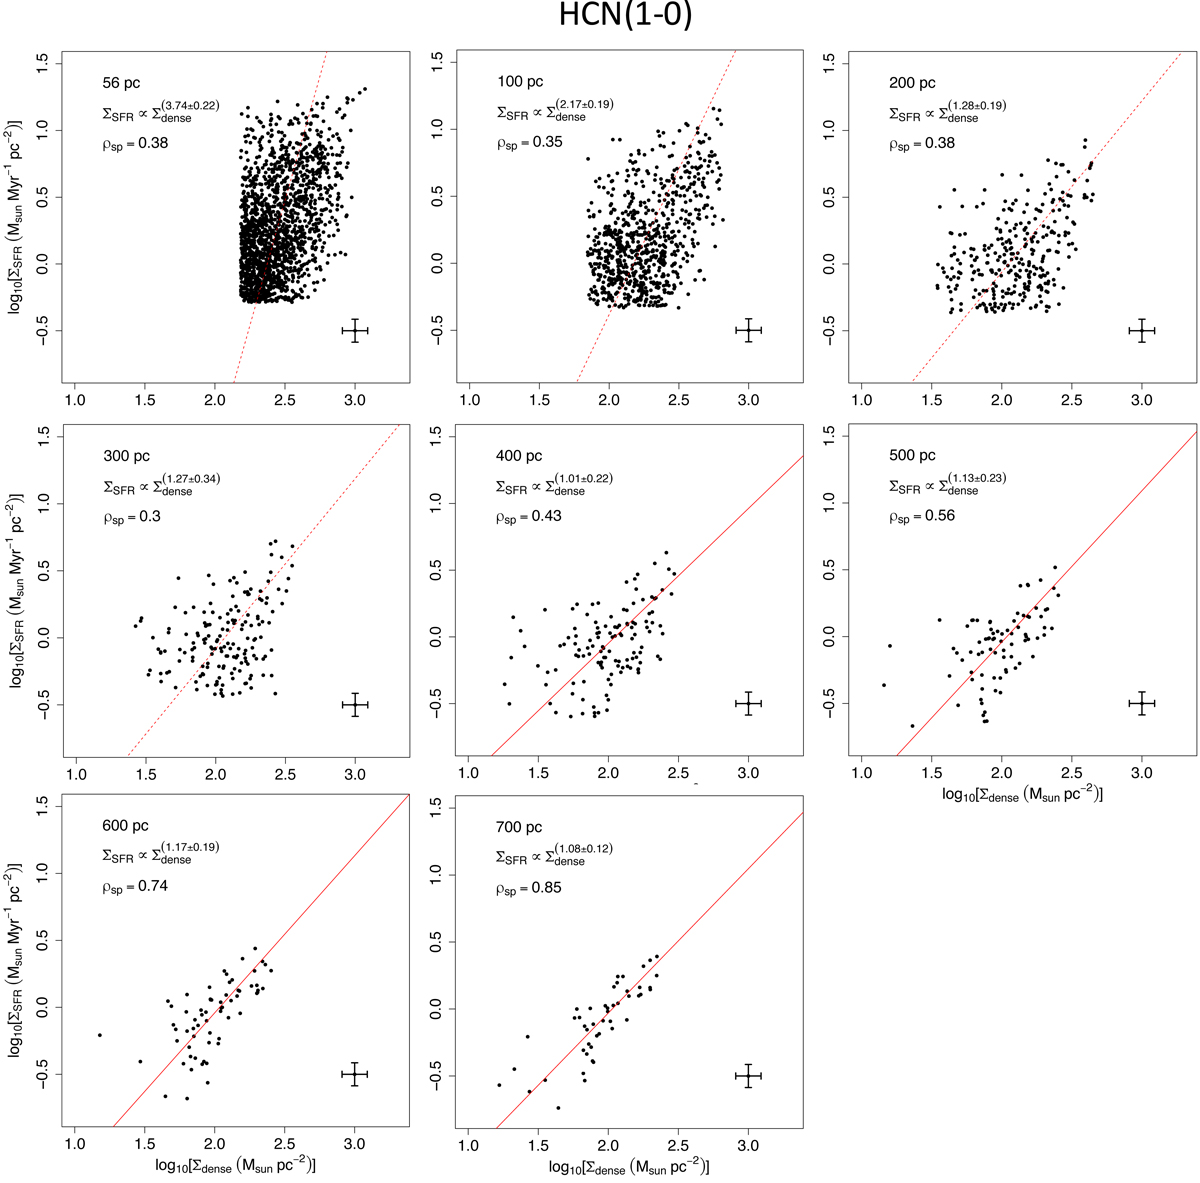
Fig. 5.
Download original image
SFR surface density (ΣSFR) as a function of the dense molecular gas surface density (Σdense) derived from HCN(1–0) for the different resolutions explored in this work: 56 pc, 100 pc, 200 pc, 300 pc, 400 pc, 500 pc, 600 pc and 700 pc. The red lines show the ODR fits to the data. The dashed lines identify the correlations that are not found to be statistically significant. We only show on both axes the data points above 3σ that are considered in the fits. We indicate the Spearman’s rank correlation coefficients (ρsp) and the power-law indexes (N) of the best fits. Vertical and horizontal error bars at the lower-right corner of each panel account for the typical uncertainties, which amount to ±0.09 dex on both axes.
Current usage metrics show cumulative count of Article Views (full-text article views including HTML views, PDF and ePub downloads, according to the available data) and Abstracts Views on Vision4Press platform.
Data correspond to usage on the plateform after 2015. The current usage metrics is available 48-96 hours after online publication and is updated daily on week days.
Initial download of the metrics may take a while.