Fig. 4.
Download original image
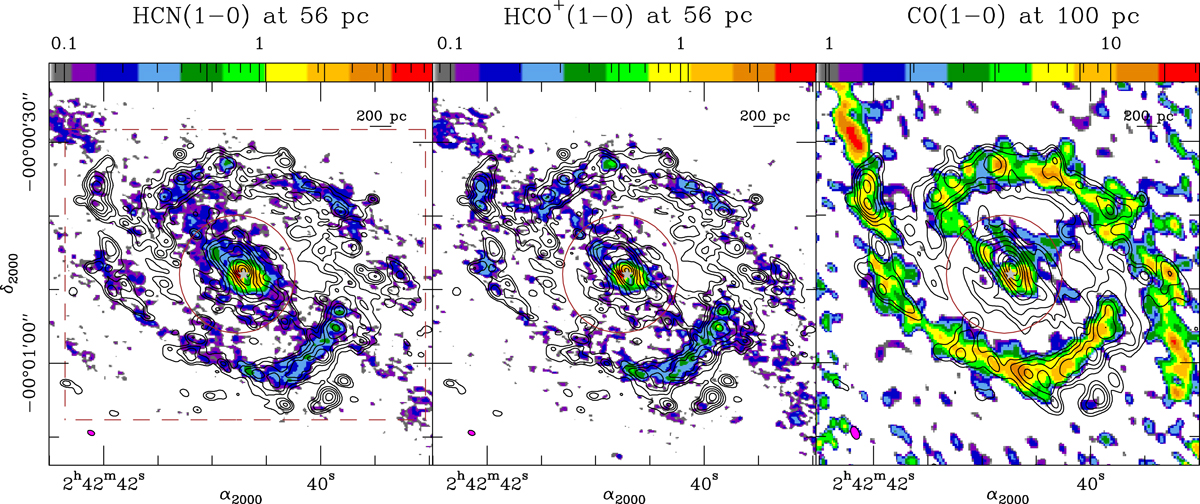
Overlay of the HST/NICMOS Paα image on the molecular gas tracer maps. Left panel: overlay of the HST/NICMOS Paα image (contours) on the ALMA HCN(1–0) map (colour scale). Contours have a logarithmic spacing from 3σ to 1536σ, in steps of 0.3 dex, where 1σ = 0.180−16 erg s−1 cm−2 pixel−1. The colour scale is shown in units of Jy beam−1 km s−1. Middle panel: same as the left panel but showing the overlay of the HST/NICMOS Paα contours on the ALMA HCO+(1–0) map (colour scale). Right panel: same as the left panel but showing the overlay of the HST/NICMOS Paα contours on the PdBI CO(1–0) map of Schinnerer et al. (2000) (colour scale). Contour spacing is the same as in the left and right panels, but with 1σ = 0.162 × 10⁻¹⁶ erg s−1 cm−2 pixel−1. The magenta filled ellipses at the bottom-left corners in all panels represent the beam sizes of the molecular line maps: 1![]() 0 × 0
0 × 0![]() 6 at PA = 69° (left and middle panels) and 1
6 at PA = 69° (left and middle panels) and 1![]() 84 × 1
84 × 1![]() 09 at PA = 24° (right panel). The HST/NICMOS Paα images in each panel have been degraded to the corresponding spatial resolutions of the molecular gas tracers used in this comparison. Other symbols are the same as in Fig. 2.
09 at PA = 24° (right panel). The HST/NICMOS Paα images in each panel have been degraded to the corresponding spatial resolutions of the molecular gas tracers used in this comparison. Other symbols are the same as in Fig. 2.
Current usage metrics show cumulative count of Article Views (full-text article views including HTML views, PDF and ePub downloads, according to the available data) and Abstracts Views on Vision4Press platform.
Data correspond to usage on the plateform after 2015. The current usage metrics is available 48-96 hours after online publication and is updated daily on week days.
Initial download of the metrics may take a while.