Fig. 3.
Download original image
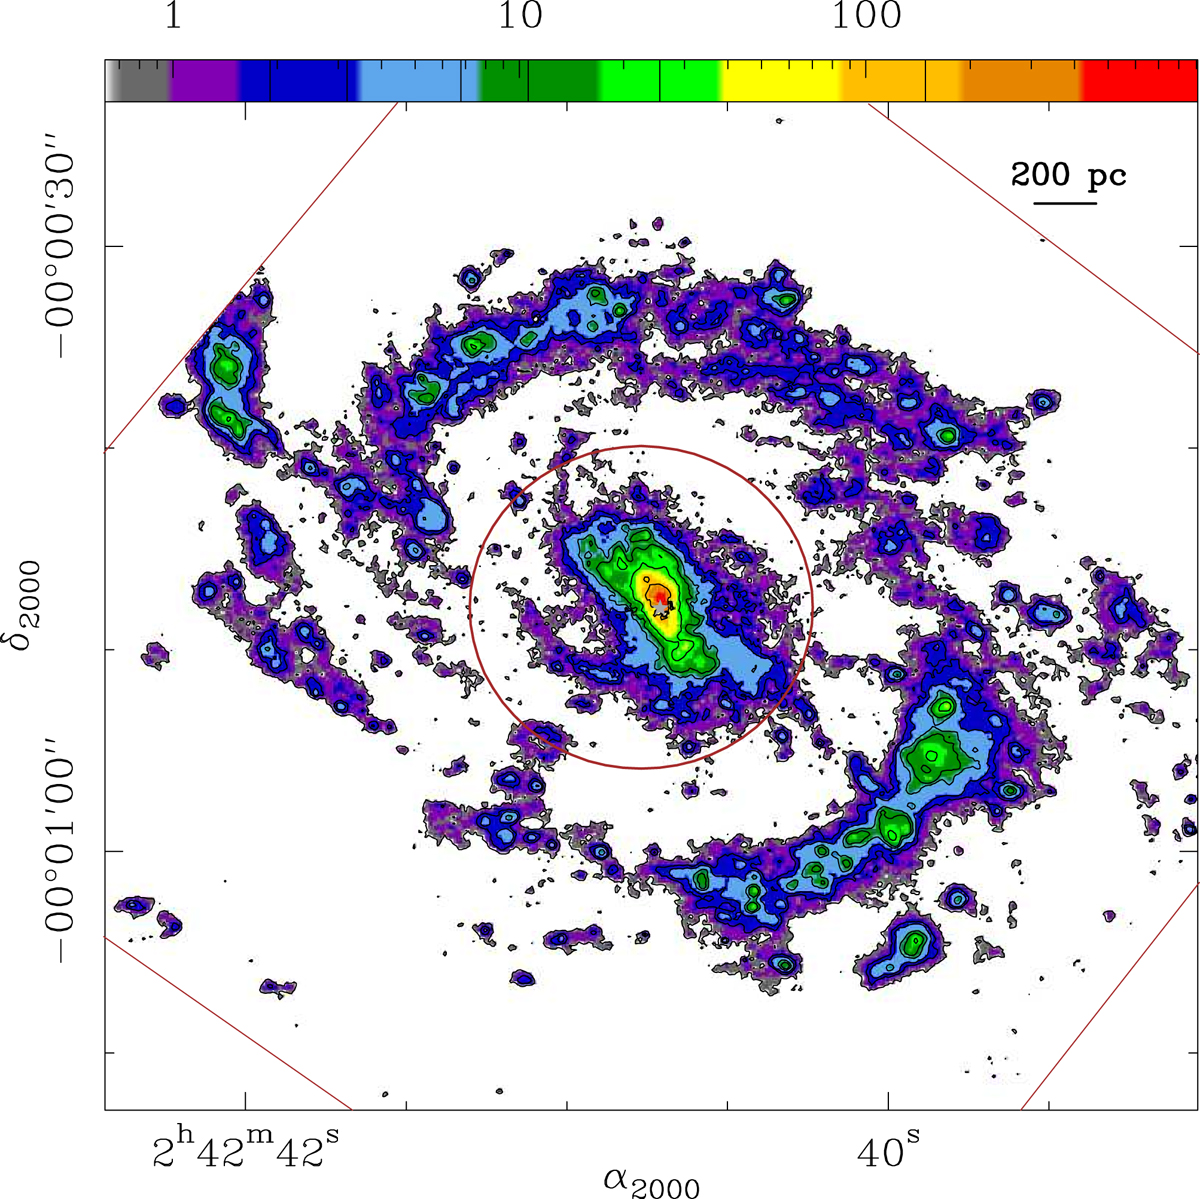
HST/NICMOS continuum-subtracted Paα image of NGC 1068. The map is shown in colour scale with contour levels of 3σ, 9σ, 15σ, 32σ, 50σ, 120σ, and 700σ, where 1σ = 0.212 × 10⁻¹⁶ erg s−1 cm−2 pixel−1. The colour scale range is shown in units of 10−16 erg s−1 cm−2 pixel−1. The (truncated) square region identifies the outer edge of the HST/NICMOS FOV. The angular resolution of the image is 0![]() 26 × 0
26 × 0![]() 26. Other symbols are the same as in Fig. 2.
26. Other symbols are the same as in Fig. 2.
Current usage metrics show cumulative count of Article Views (full-text article views including HTML views, PDF and ePub downloads, according to the available data) and Abstracts Views on Vision4Press platform.
Data correspond to usage on the plateform after 2015. The current usage metrics is available 48-96 hours after online publication and is updated daily on week days.
Initial download of the metrics may take a while.