Free Access
Fig. 13.
Download original image
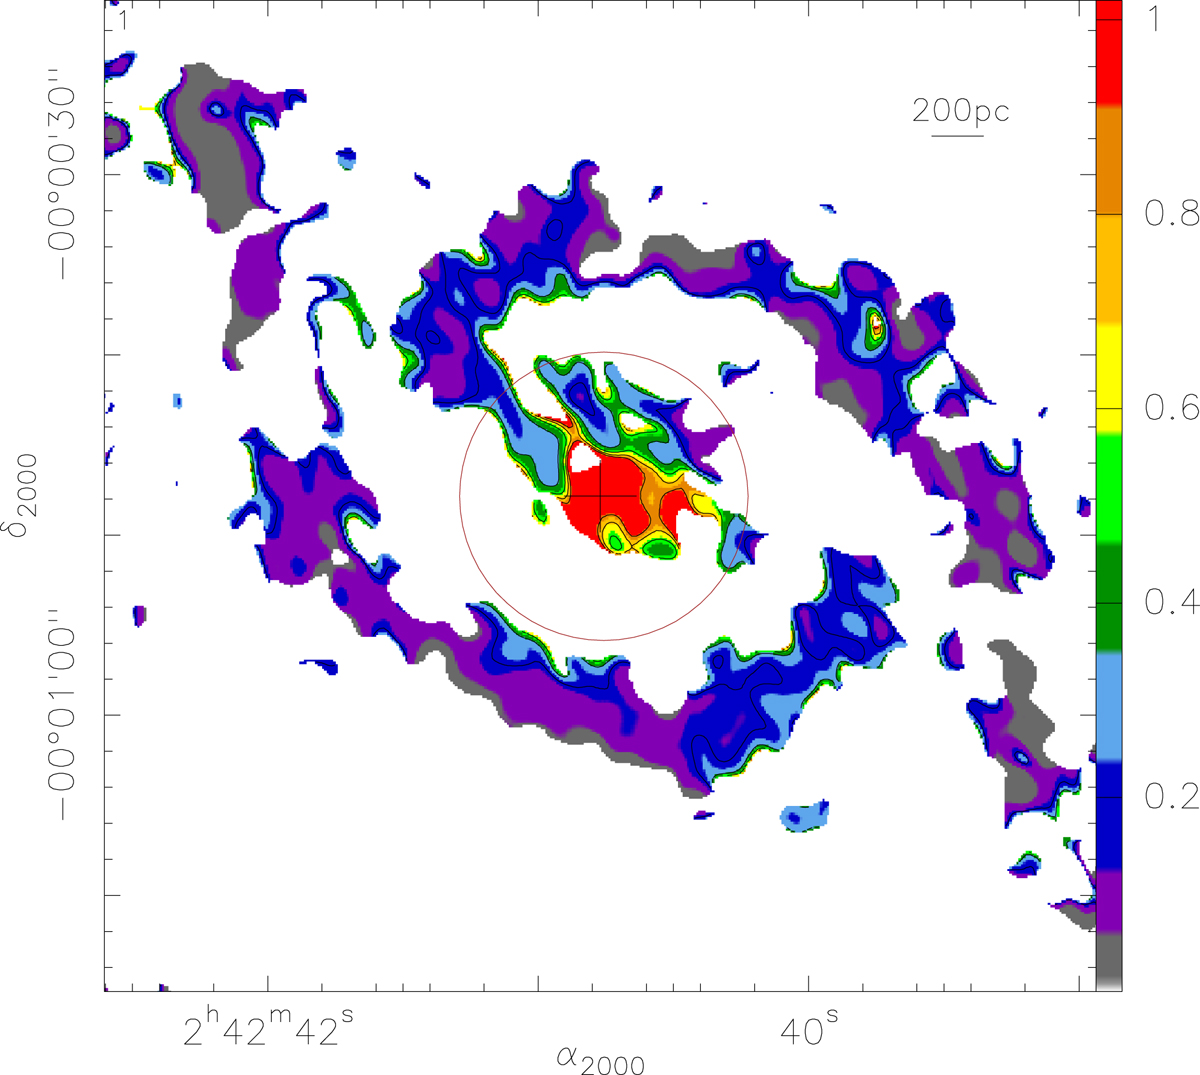
HCN(1–0)/CO(1–0) brightness temperature ratio map (RHCN/CO; colour scale and contours) derived at the common (lower) spatial resolution of the CO(1–0) observations of Schinnerer et al. (2000) (≃100 pc). The brown circle of 8″ in radius (≃560 pc) locates the inner region excluded from our analysis of SF relations.
Current usage metrics show cumulative count of Article Views (full-text article views including HTML views, PDF and ePub downloads, according to the available data) and Abstracts Views on Vision4Press platform.
Data correspond to usage on the plateform after 2015. The current usage metrics is available 48-96 hours after online publication and is updated daily on week days.
Initial download of the metrics may take a while.