Fig. 12.
Download original image
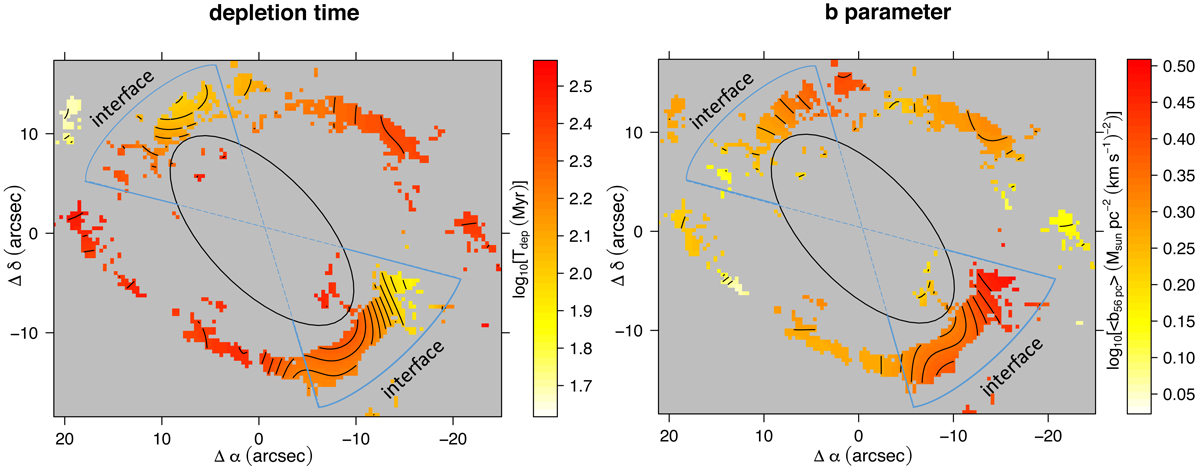
Maps of the depletion time and the b parameter in the SB ring of NGC 1068. Left panel: map of the depletion time of the dense molecular gas (![]() ) obtained after using 400 pc as an averaging scale. Contour levels for log10(
) obtained after using 400 pc as an averaging scale. Contour levels for log10(![]() ) go from 1.50 to 2.22 in steps of 0.045 (in Myr). Right panel: map of the intensity-weighted average of the b parameter (⟨b⟩) in the SB ring of NGC 1068 obtained after using 400 pc as an averaging scale. Contour levels for log10(⟨b⟩) go from 0.075 to 0.45 in steps of 0.025 (in M⊙ pc−2 (km s−1)−2). The Δα and Δδ offsets in arc seconds are relative to the phase tracking centre of ALMA. The ellipse identifies the extent of the nuclear stellar bar in the disk. We highlight the approximate extent of the bar-ring interface region in both panels.
) go from 1.50 to 2.22 in steps of 0.045 (in Myr). Right panel: map of the intensity-weighted average of the b parameter (⟨b⟩) in the SB ring of NGC 1068 obtained after using 400 pc as an averaging scale. Contour levels for log10(⟨b⟩) go from 0.075 to 0.45 in steps of 0.025 (in M⊙ pc−2 (km s−1)−2). The Δα and Δδ offsets in arc seconds are relative to the phase tracking centre of ALMA. The ellipse identifies the extent of the nuclear stellar bar in the disk. We highlight the approximate extent of the bar-ring interface region in both panels.
Current usage metrics show cumulative count of Article Views (full-text article views including HTML views, PDF and ePub downloads, according to the available data) and Abstracts Views on Vision4Press platform.
Data correspond to usage on the plateform after 2015. The current usage metrics is available 48-96 hours after online publication and is updated daily on week days.
Initial download of the metrics may take a while.