Fig. 11.
Download original image
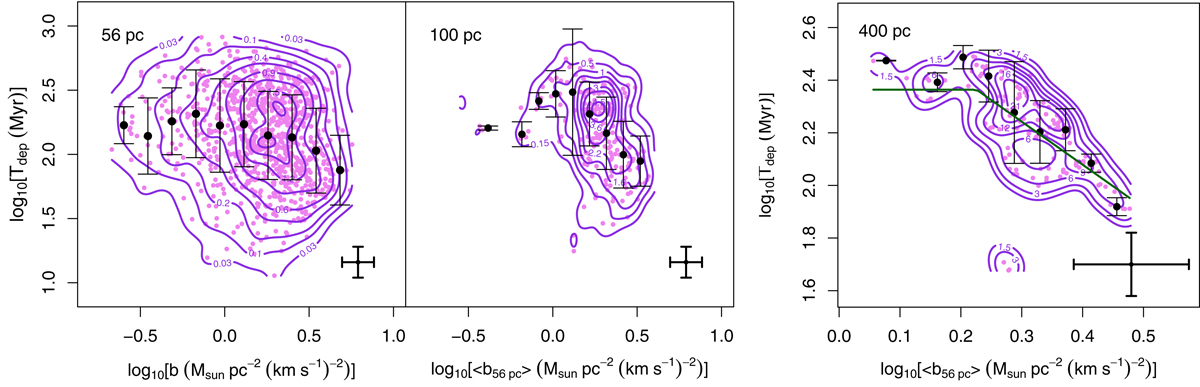
Depletion time of the dense molecular gas estimated from HCN, ![]() /ΣSFR, as a function of the self-gravity of the gas, measured by the parameter b ≡ Σdense/σ2, at different spatial scales (magenta circles and isodensity contours): 56 pc, namely the initial resolution of ALMA observations (left panel), 100 pc (middle panel), and 400 pc (right panel). A significant trend in
/ΣSFR, as a function of the self-gravity of the gas, measured by the parameter b ≡ Σdense/σ2, at different spatial scales (magenta circles and isodensity contours): 56 pc, namely the initial resolution of ALMA observations (left panel), 100 pc (middle panel), and 400 pc (right panel). A significant trend in ![]() as a function of b, identified in the middle and right panels, indicates a higher rate of SF per unit mass of dense gas for regions with stronger self-gravity. Values of ⟨b⟩ for the 100 pc and 400 pc apertures were derived from an intensity-weighted average of b evaluated at the Nyquist-sampled grid of points for each aperture. Values of
as a function of b, identified in the middle and right panels, indicates a higher rate of SF per unit mass of dense gas for regions with stronger self-gravity. Values of ⟨b⟩ for the 100 pc and 400 pc apertures were derived from an intensity-weighted average of b evaluated at the Nyquist-sampled grid of points for each aperture. Values of ![]() were derived using a Gaussian-weighted average. Black circles show median
were derived using a Gaussian-weighted average. Black circles show median ![]() , and error bars indicate the rms scatter in the bins. The green lines in the right panel identify the two regimes in the
, and error bars indicate the rms scatter in the bins. The green lines in the right panel identify the two regimes in the ![]() plot found by the MARS algorithm to fit the data using 400 pc as averaging scale. Vertical and horizontal error bars at the lower-right corner of each panel account for the typical uncertainties, which amount to ±0.13 dex and ±0.09 dex, respectively.
plot found by the MARS algorithm to fit the data using 400 pc as averaging scale. Vertical and horizontal error bars at the lower-right corner of each panel account for the typical uncertainties, which amount to ±0.13 dex and ±0.09 dex, respectively.
Current usage metrics show cumulative count of Article Views (full-text article views including HTML views, PDF and ePub downloads, according to the available data) and Abstracts Views on Vision4Press platform.
Data correspond to usage on the plateform after 2015. The current usage metrics is available 48-96 hours after online publication and is updated daily on week days.
Initial download of the metrics may take a while.