Fig. 1.
Download original image
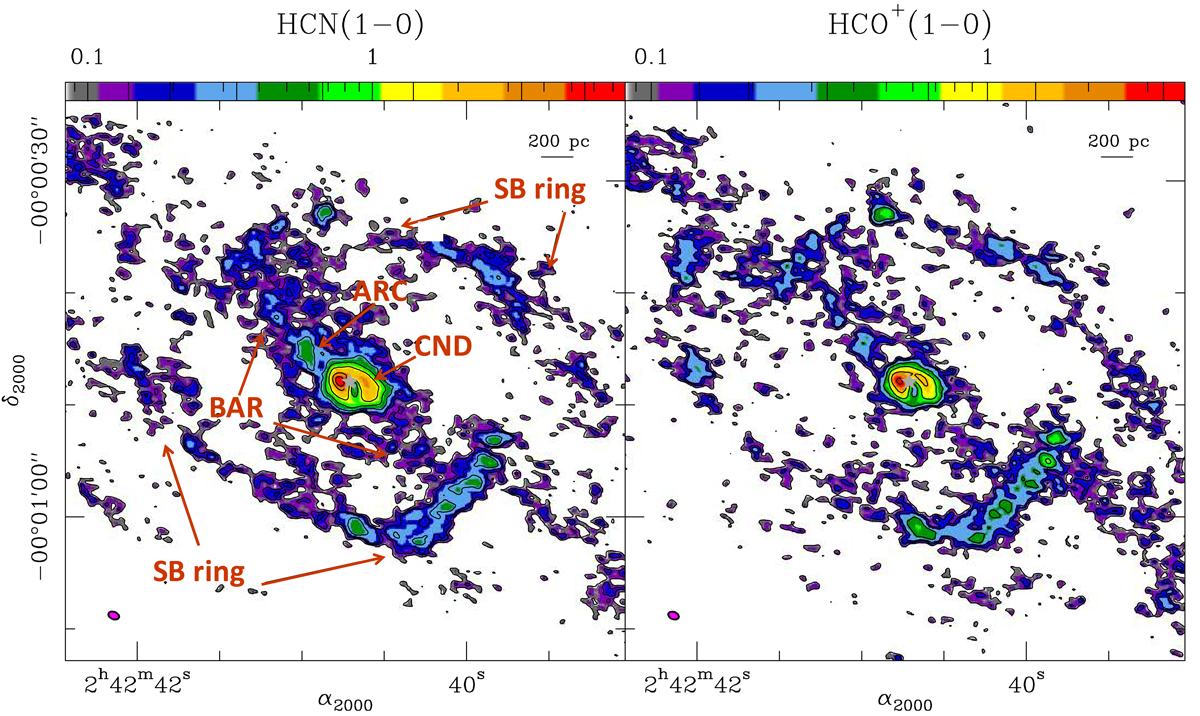
HCN(1–0) and HCO+(1–0) integrated intensity maps of NGC 1068. Left panel: velocity-integrated intensity map of HCN(1–0) of NGC 1068 obtained with ALMA. The map is shown in a logarithmic colour scale with contour levels of 3σ, 5σ, 7σ, 12σ, 24σ, 50σ, 120σ, and 200σ, where 1σ = 0.028 Jy beam−1 km s−1. We highlight the location of several representative regions of the emission, namely the CND, the bar, and the SB ring. Right panel: same as the left panel but for the HCO+(1–0) line map, with the same list of contour levels but here truncated at 120σ. The position of the AGN is identified by the dark grey star marker. The black bar in the top-right corner of each panel shows the spatial scale (in pc). The magenta filled ellipses at the bottom-left corners of the panels represent the ALMA beam size (1![]() 0 × 0
0 × 0![]() 6 at PA = 69°).
6 at PA = 69°).
Current usage metrics show cumulative count of Article Views (full-text article views including HTML views, PDF and ePub downloads, according to the available data) and Abstracts Views on Vision4Press platform.
Data correspond to usage on the plateform after 2015. The current usage metrics is available 48-96 hours after online publication and is updated daily on week days.
Initial download of the metrics may take a while.