Fig. 9.
Download original image
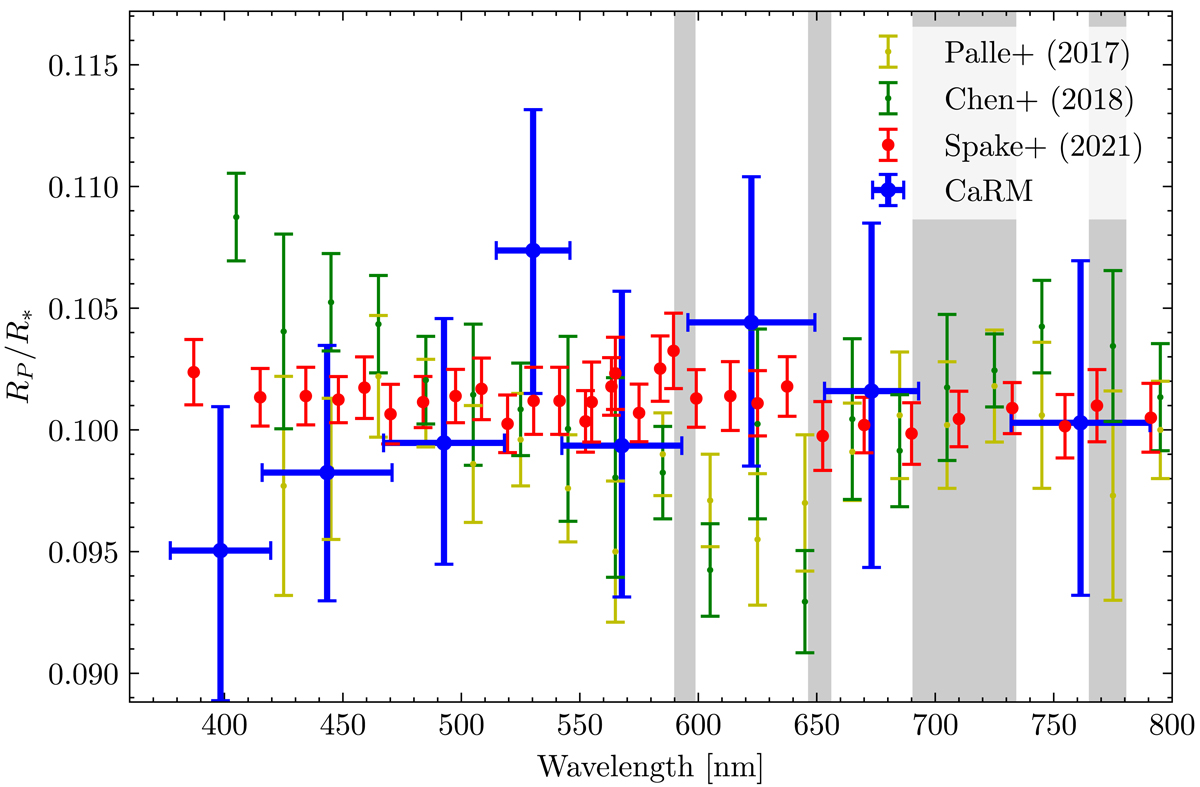
WASP-127b transmission spectrum retrieved with CaRM, with ARoME, compared with other sources in the literature (Palle et al. 2017 with NOT/ALFOSC; Chen et al. 2018 with NOT/ALFOSC and GTC/OSIRIS; and Spake et al. 2021 with HST/STIS and TESS). The gray bars represent the wavelength intervals where the CCFs were masked to mitigate atmospheric contamination. The horizontal bars, in our retrieval, correspond to the binning in wavelength.
Current usage metrics show cumulative count of Article Views (full-text article views including HTML views, PDF and ePub downloads, according to the available data) and Abstracts Views on Vision4Press platform.
Data correspond to usage on the plateform after 2015. The current usage metrics is available 48-96 hours after online publication and is updated daily on week days.
Initial download of the metrics may take a while.