Fig. 5.
Download original image
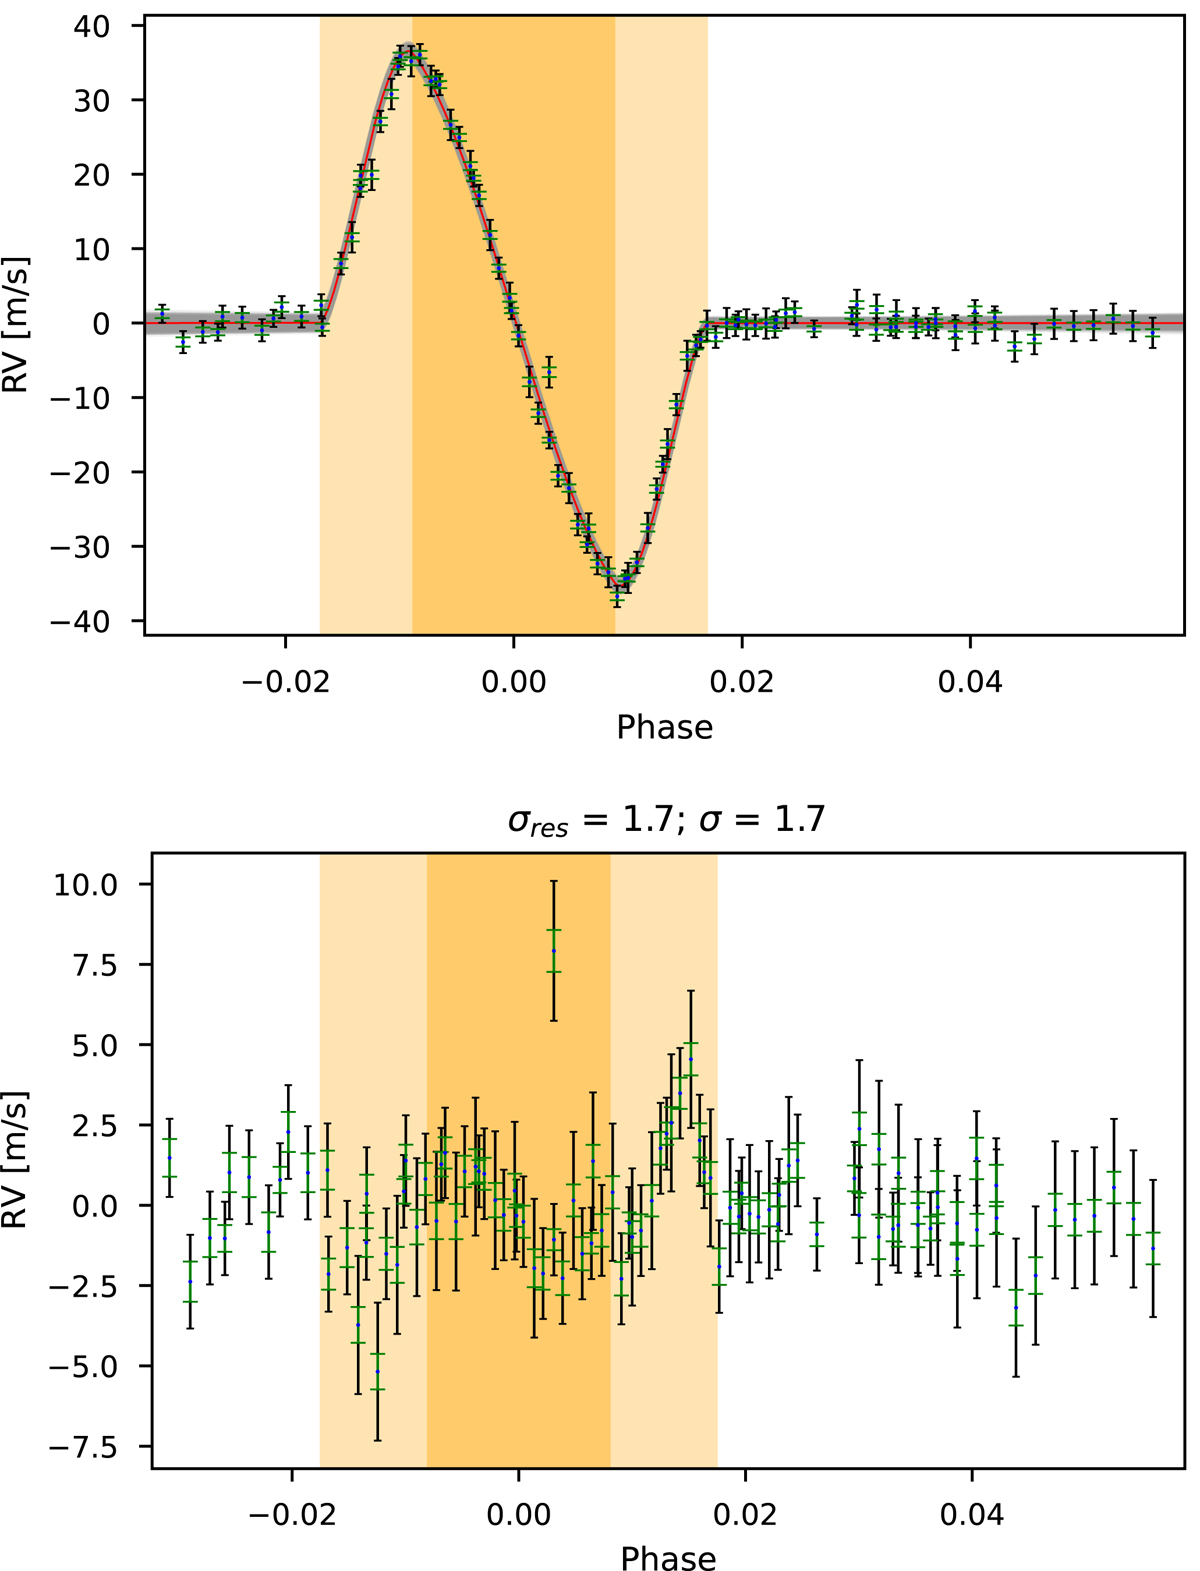
HD 189733 RM fit. Top: best fit model (solid red) of the combined observations of HD 189733b with HARPS. The gray area corresponds to a random sample of the posterior about the highest likelihood. The data points present two error bars, the green corresponding to the original RVs’ uncertainties computation from the CCF method and the black after quadratically adding the white-noise level fitted to the data. Bottom: residuals after subtraction of the data from the best-fit. The lighter yellow represents the ingress and egress and the darker the region where the planet is fully in front of the stellar disk. At the top of the residual’s plot, σres represents the average value of the RVs’ residual dispersion, σW is the estimate of the jitter velocity, and σ is the average uncertainty in the residual RVs.
Current usage metrics show cumulative count of Article Views (full-text article views including HTML views, PDF and ePub downloads, according to the available data) and Abstracts Views on Vision4Press platform.
Data correspond to usage on the plateform after 2015. The current usage metrics is available 48-96 hours after online publication and is updated daily on week days.
Initial download of the metrics may take a while.