Fig. 5.
Download original image
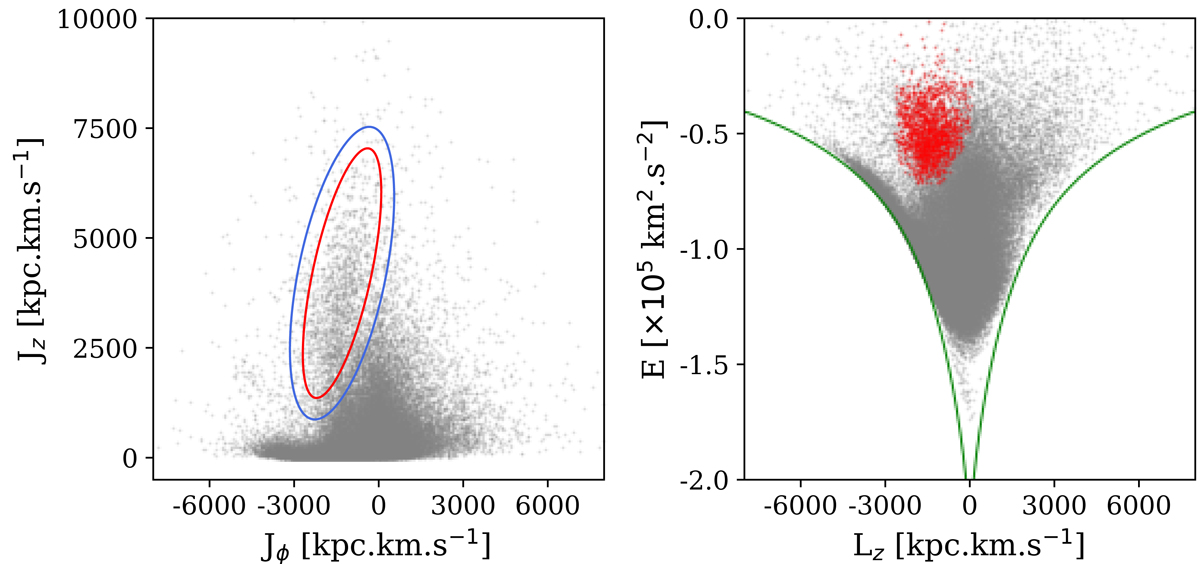
Azimuthal and vertical actions of the stars from the SEGUE dataset (left), and corresponding energy-vertical angular momentum diagram (right). The green lines mark the locus of circular orbits in the Milky Way model. The red ellipse on the left panel shows clearly visible structure corresponding to the Sagittarius stream. The stars inside that selection are highlighted in red in the right panel. The stars between the red and blue ellipses in the left panel are used to estimate the background contamination, which is used in Fig. 6.
Current usage metrics show cumulative count of Article Views (full-text article views including HTML views, PDF and ePub downloads, according to the available data) and Abstracts Views on Vision4Press platform.
Data correspond to usage on the plateform after 2015. The current usage metrics is available 48-96 hours after online publication and is updated daily on week days.
Initial download of the metrics may take a while.