Fig. 3.
Download original image
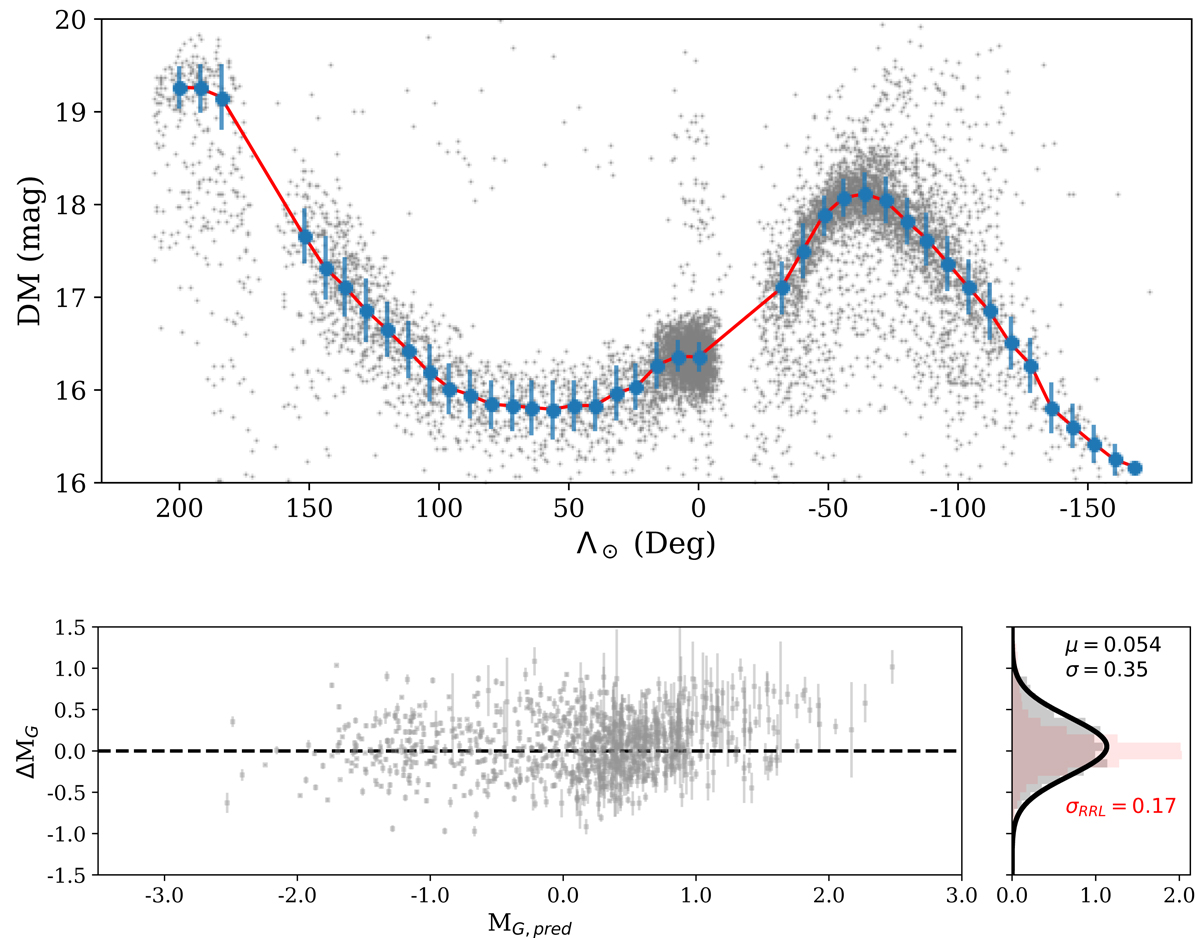
Top panel: distance modulus of the Sgr RR Lyrae as a function of longitude along the plane of the Sagittarius stream, as defined by Majewski et al. (2003) (in grey). The blue error bars show the mean and standard deviation of the RR Lyrae DM as a function of the Λ⊙ position, and are used to define the Sgr DM track represented by the red cubic spline function. Bottom panels: difference between the absolute magnitude derived by the DM ridgeline and the absolute magnitude predicted by our algorithm as a function of the predicted absolute magnitude for stars along the Sgr stream (left). On the right panel, the red histogram shows the normalised residuals of the DM of the RR Lyrae to the fitted ridgeline along the Sgr stream.
Current usage metrics show cumulative count of Article Views (full-text article views including HTML views, PDF and ePub downloads, according to the available data) and Abstracts Views on Vision4Press platform.
Data correspond to usage on the plateform after 2015. The current usage metrics is available 48-96 hours after online publication and is updated daily on week days.
Initial download of the metrics may take a while.