Fig. 2.
Download original image
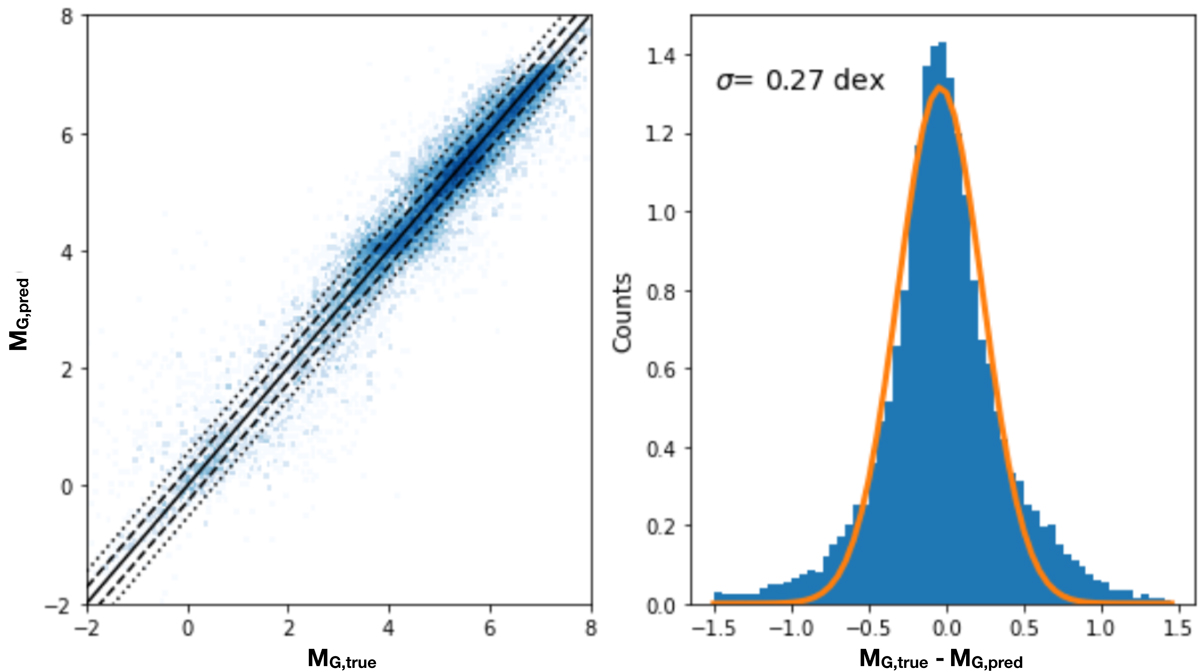
Comparison of the ‘true’ (MG, true) and predicted (MG, pred) absolute magnitude for the stars of the training sample. Left panel: the true and derived quantities plotted against each other. The one-to-one relation is shown as a solid line, and the dashed and dotted lines correspond to the 1 − σ and 2 − σ deviations, respectively. Right panel: the distribution of the difference between the true and derived absolute magnitude, with a Gaussian fit overlaid. A scatter of 0.27 mag corresponds to a relative uncertainty on the distance of 13%.
Current usage metrics show cumulative count of Article Views (full-text article views including HTML views, PDF and ePub downloads, according to the available data) and Abstracts Views on Vision4Press platform.
Data correspond to usage on the plateform after 2015. The current usage metrics is available 48-96 hours after online publication and is updated daily on week days.
Initial download of the metrics may take a while.