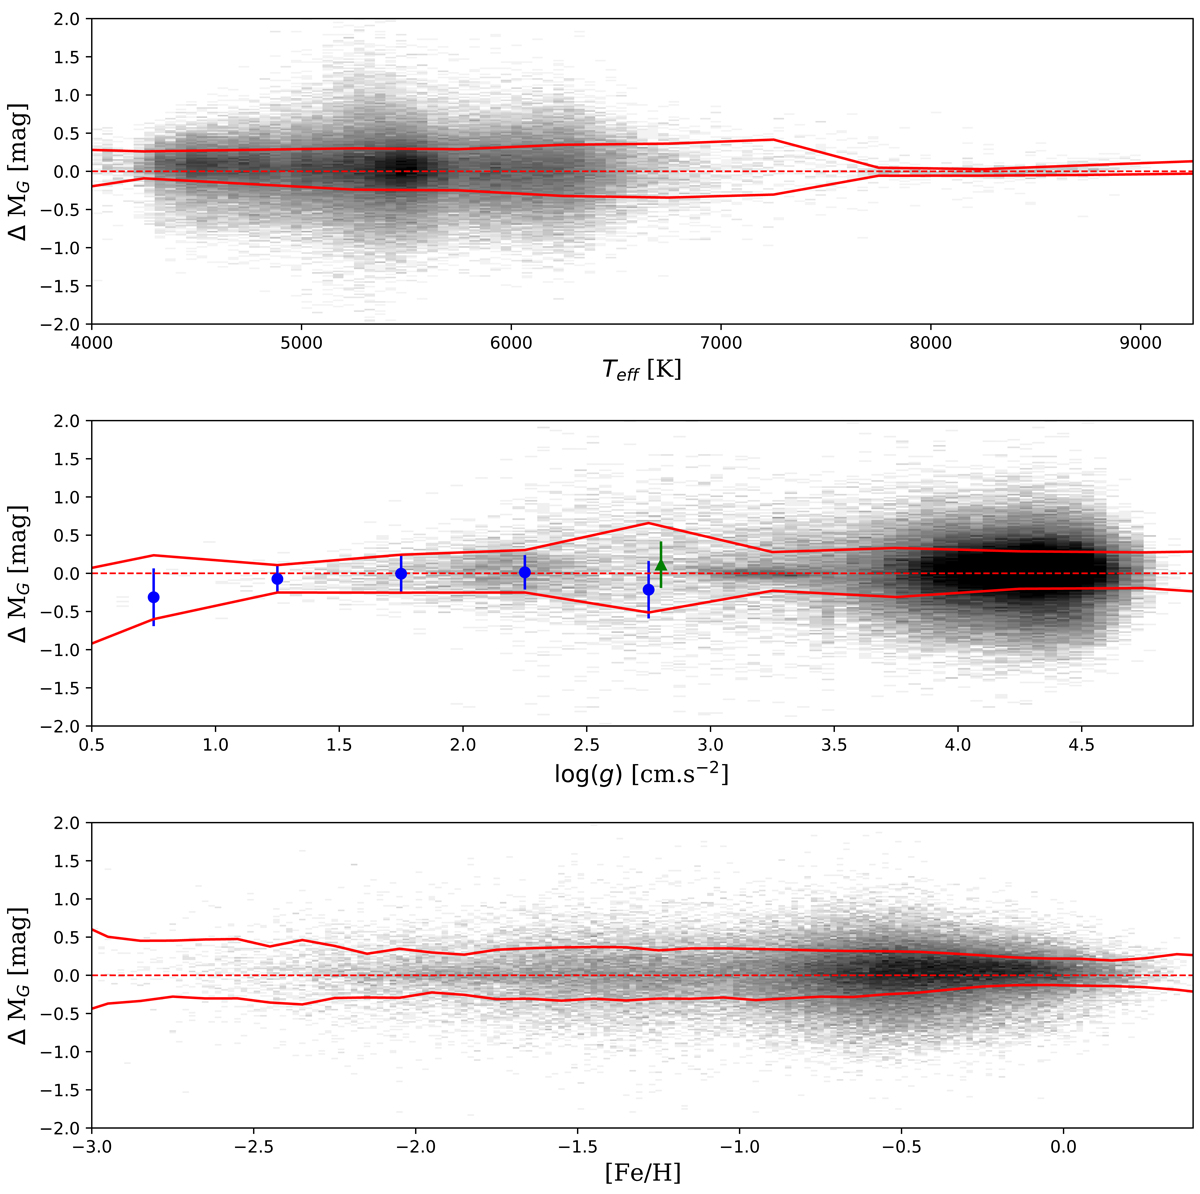
Fig. B.1.
Download original image
Variation in the residual between the ‘true’ and predicted absolute magnitudes with the effective temperature (upper panel), the surface gravity (middle panel), and the metallicity (lower panel). The dotted line shows cases where the predicted and the ‘true’ absolute magnitude are equal. The red continuous line shows the variation in this residual as a function of these parameters. In the middle panel, the blue dots show the evolution of the residual for the K-giant stars of the catalogue of Xue et al. (2014), and the green triangle shows it for the 229 stars between 2.5 < log(g) < 3.0 dex and with relative precision on their parallax of ϖ/δϖ≥10.
Current usage metrics show cumulative count of Article Views (full-text article views including HTML views, PDF and ePub downloads, according to the available data) and Abstracts Views on Vision4Press platform.
Data correspond to usage on the plateform after 2015. The current usage metrics is available 48-96 hours after online publication and is updated daily on week days.
Initial download of the metrics may take a while.