Fig. 14.
Download original image
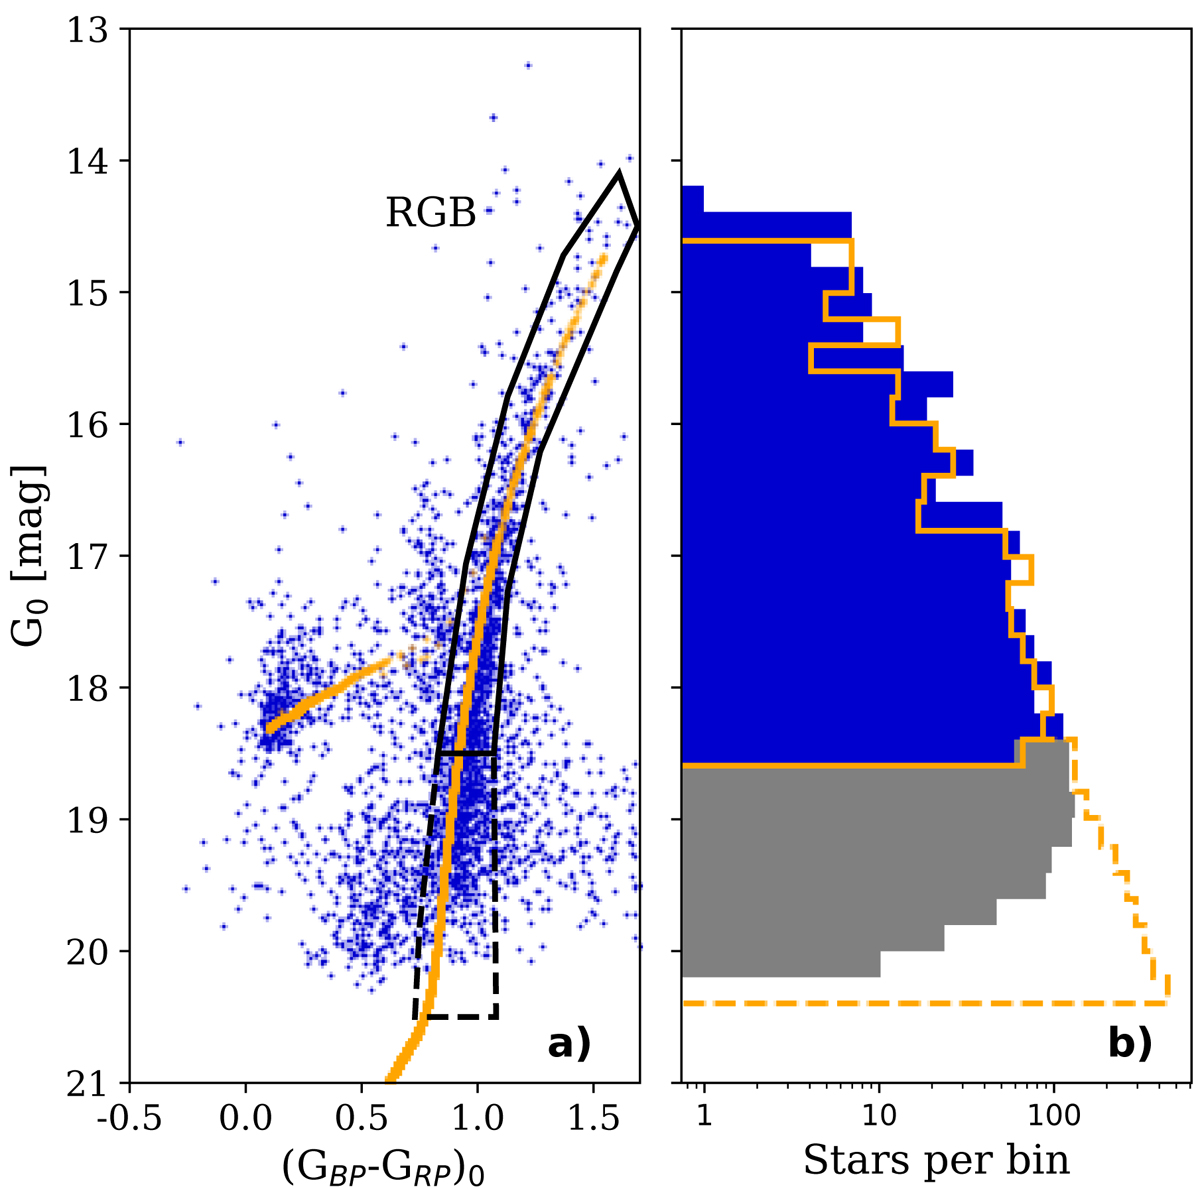
Panel a: CMD of the stars located in the Cetus-Palca selection box (blue rectangle in Fig. 12) overlaid with a 14 Gyr isochrone with a metallicity of [Fe/H] = −1.93 (in orange). The black plain polygon shows the location of the RGB stars with the region where Gaia is complete, while the region where Gaia is not complete is shown by the dashed line polygon. Panel b: luminosity function of the RGB used to estimate the stellar mass of the Cetus-Palca stream (in blue), with the area affected by the drop in completeness (in grey). The orange histogram shows the luminosity function of a 1.5 × 10⁶ M⊙, [Fe/H] = −1.93, 14 Gyr-old RGB population following a Kroupa mass function.
Current usage metrics show cumulative count of Article Views (full-text article views including HTML views, PDF and ePub downloads, according to the available data) and Abstracts Views on Vision4Press platform.
Data correspond to usage on the plateform after 2015. The current usage metrics is available 48-96 hours after online publication and is updated daily on week days.
Initial download of the metrics may take a while.