Fig. 12.
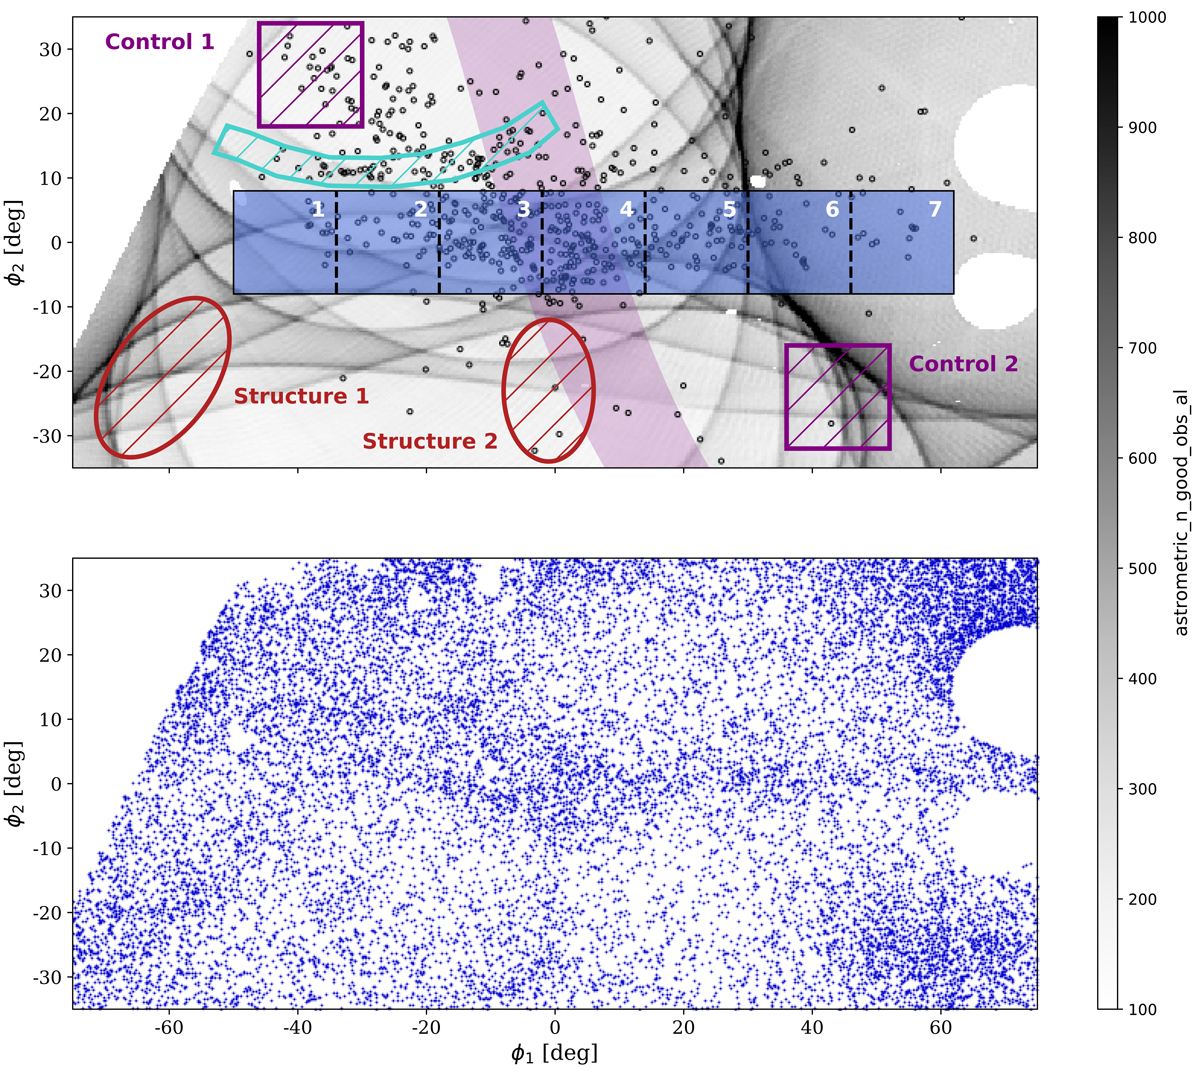
Download original image
Lower panel: position of the stars with PCetus ≥ 0.2. Upper panel: The black circles show the position of the BHB of Cetus-Palca identified in Sect. 4.2.2, and the yellow stars show the position of the 56 stars of the Cetus-Palca spectroscopic sample with common orbital behaviour. The blue rectangle highlights the position of the Cetus-Palca stream visible in the lower panel. The stream is decomposed into seven boxes of equal area used to measure the spatial variation of the CMDs in Fig. 13. The cyan polygon highlights the position of the potential globular cluster stream that we find in this work. The two purple dashed rectangles highlight the region located outside the Cetus-Palca stream used to show the MW foreground and background CMD. The red dashed ellipses show the positions of two additional structures visible in the lower panel. The light purple band shows the track of the Sgr stream. Finally, the black and white 2D histogram in the background shows the number of good observations along the scan direction of Gaia (ASTROMETRIC_N_GOOD_OBS_AL).
Current usage metrics show cumulative count of Article Views (full-text article views including HTML views, PDF and ePub downloads, according to the available data) and Abstracts Views on Vision4Press platform.
Data correspond to usage on the plateform after 2015. The current usage metrics is available 48-96 hours after online publication and is updated daily on week days.
Initial download of the metrics may take a while.