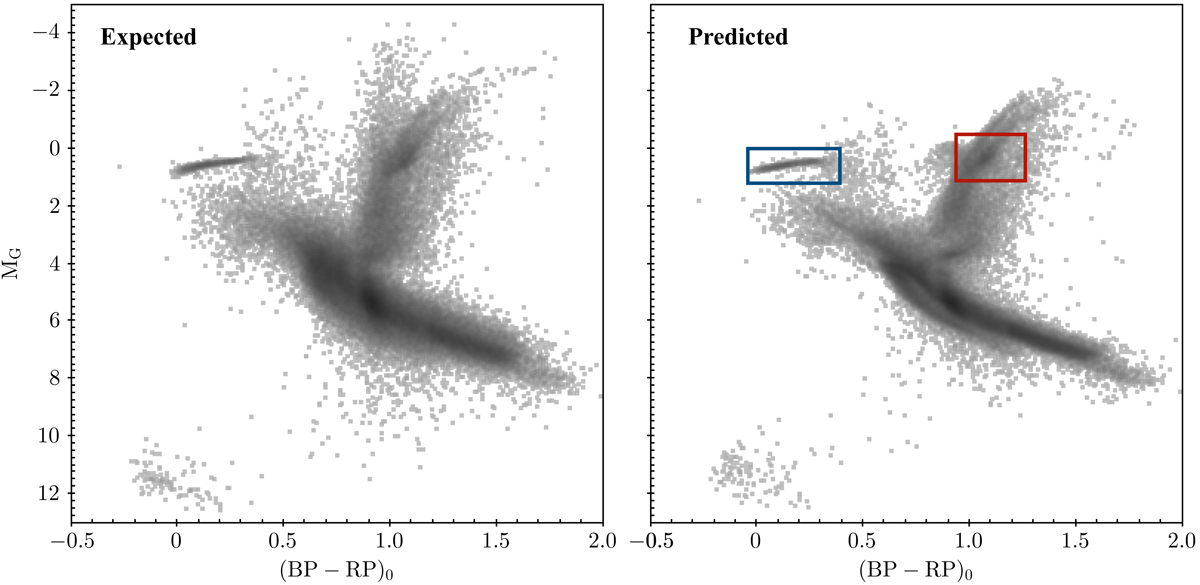
Fig. 1.
Download original image
Colour–magnitude diagram of the training sample with the expected absolute magnitude in the Gaia G-band shown in the left panel and the absolute magnitude predicted by the algorithm in the right panel. It is striking to see the RC on the predicted CMD so clearly (highlighted by the red box), while this feature it is less obvious on the expected CMD. We also highlighted with the blue rectangle the location of the BHB stars, which were added in the training sample as explained in Sect. 2.2.
Current usage metrics show cumulative count of Article Views (full-text article views including HTML views, PDF and ePub downloads, according to the available data) and Abstracts Views on Vision4Press platform.
Data correspond to usage on the plateform after 2015. The current usage metrics is available 48-96 hours after online publication and is updated daily on week days.
Initial download of the metrics may take a while.