Fig. 5.
Download original image
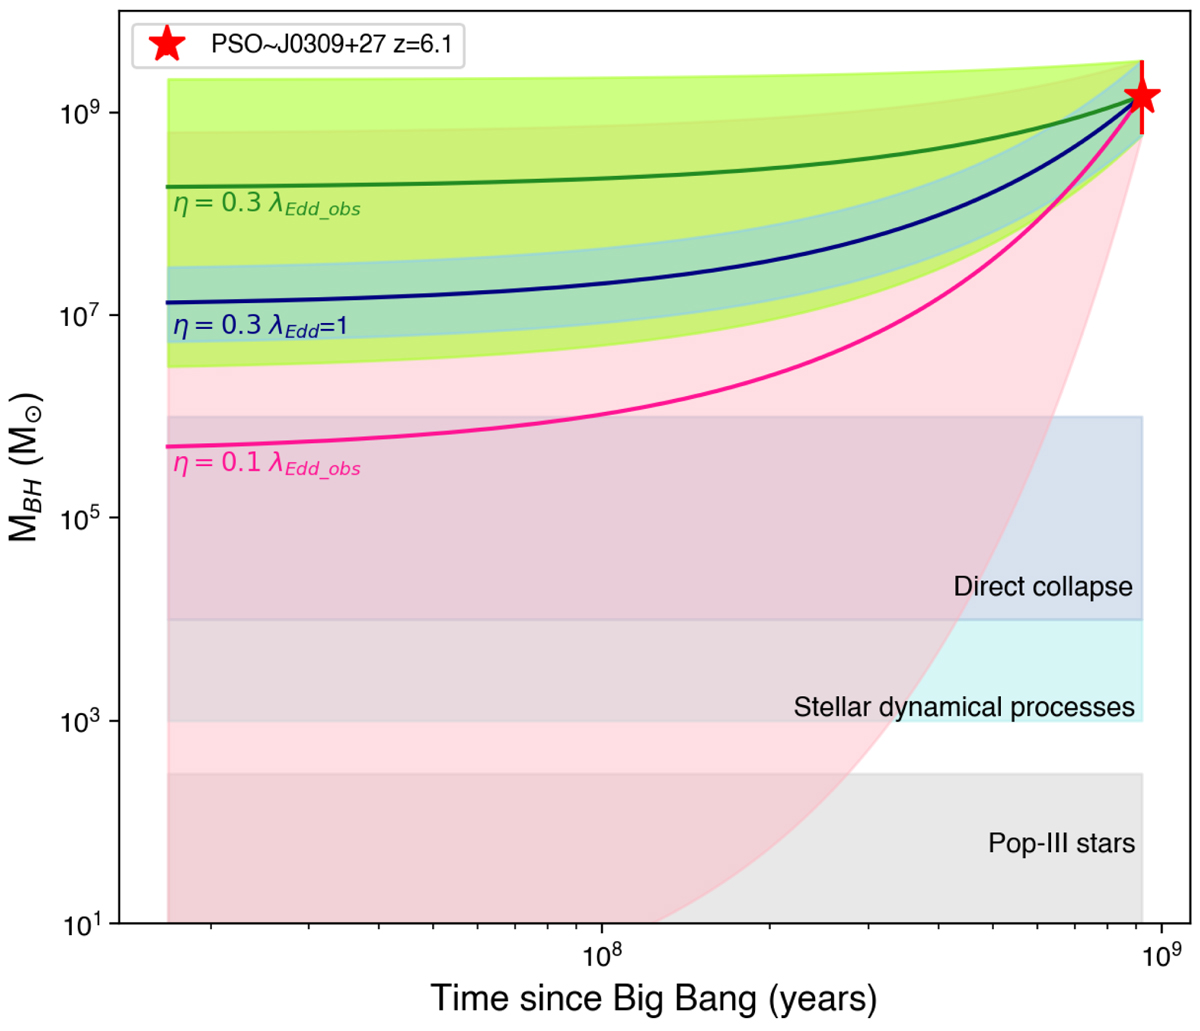
Estimated growth history of PSO J0309+27 (red star). Solid lines represent the best fit cases, under which the corresponding λEdd and η are reported. The shaded horizontal regions correspond to the expected mass ranges of Pop III remnants BHs (Mseed ≤ 102 M⊙, grey), stellar dynamical processes (Mseed ≥ 103 − 104 M⊙, cyan), and direct collapse BHs (Mseed ∼ 104 − 106 M⊙, dark cyan). The values of the different seed black holes are taken from Valiante et al. (2016).
Current usage metrics show cumulative count of Article Views (full-text article views including HTML views, PDF and ePub downloads, according to the available data) and Abstracts Views on Vision4Press platform.
Data correspond to usage on the plateform after 2015. The current usage metrics is available 48-96 hours after online publication and is updated daily on week days.
Initial download of the metrics may take a while.