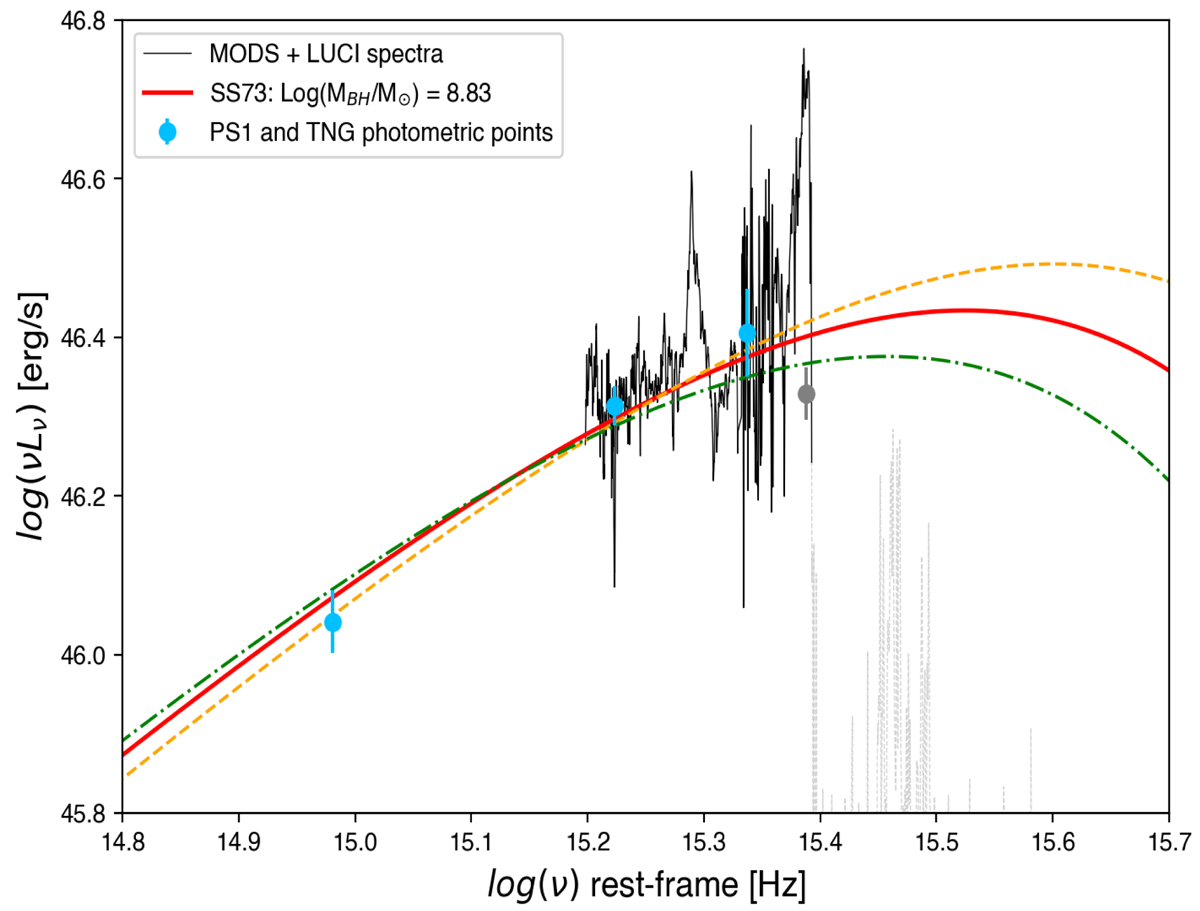
Fig. 4.
Download original image
Accretion disk model of PSO J0309+27. The SS73 model that best represents our data is shown in red. Orange dashed line and green dashed-dotted line represent the model with the minimun and maximun value of MBH respectively (5.2 × 10⁸ and 8.8 × 10⁸ M⊙). In black, we showed the optical and NIR (smoothed) spectra. The PS1 y and the TNG J and K photometric data are shown in light blue. In grey, we highlighted the photometric point and the part of the spectrum affected by HI absorption (not used for the disk modeling).
Current usage metrics show cumulative count of Article Views (full-text article views including HTML views, PDF and ePub downloads, according to the available data) and Abstracts Views on Vision4Press platform.
Data correspond to usage on the plateform after 2015. The current usage metrics is available 48-96 hours after online publication and is updated daily on week days.
Initial download of the metrics may take a while.