Fig. 9.
Download original image
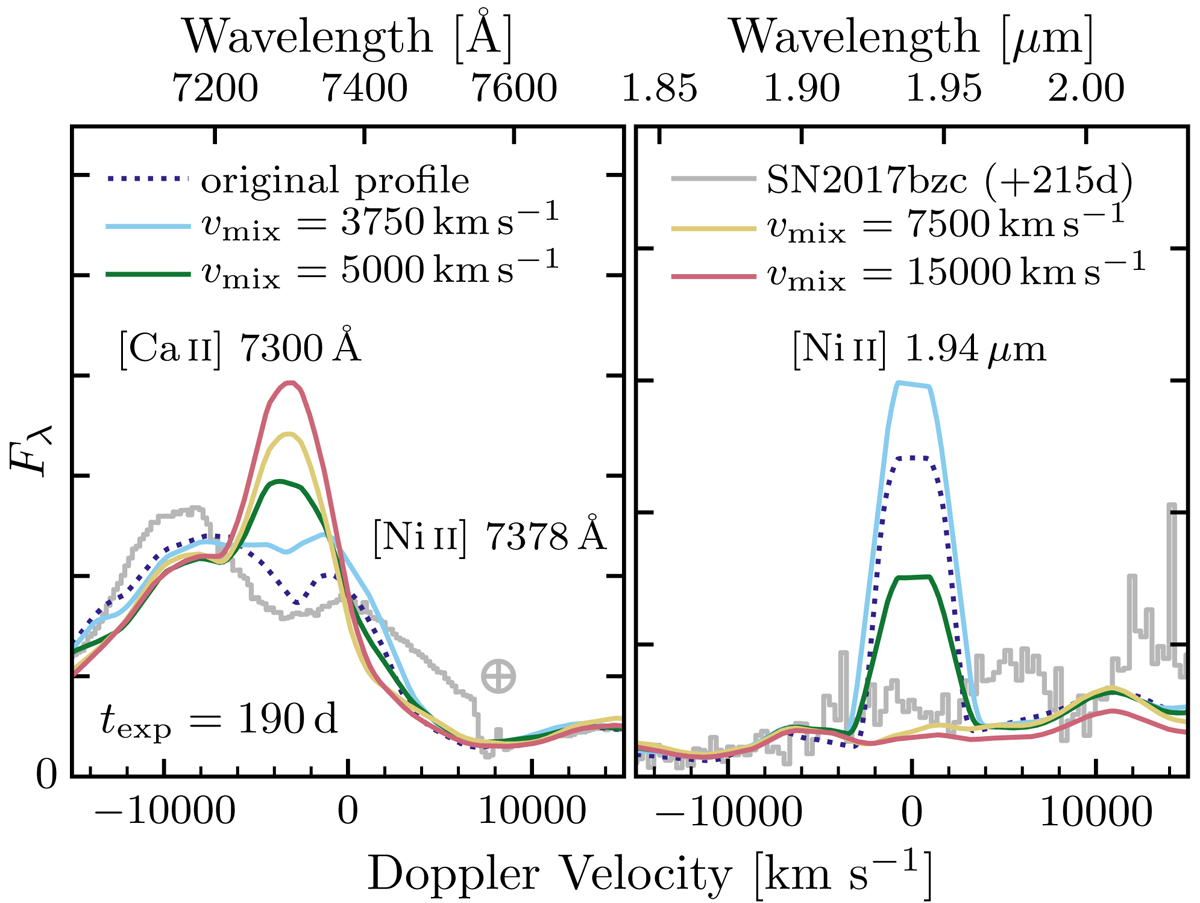
Impact of uniform mixing on the optical (left) and near-infrared (right) [Ni II] line profiles at 190 d past explosion, using the same models as in Fig. 8. Also shown are observations of SN 2017bzc at a slightly later phase (+215 d past maximum) scaled to match the mean flux of the original profile in the range 7600 − 8000 Å and 1.83 − 1.91 μm, respectively (grey line). The feature marked with a ‘⊕’ at +8000 km s−1 in the optical spectrum is due to absorption by the Earth’s atmosphere (A-band).
Current usage metrics show cumulative count of Article Views (full-text article views including HTML views, PDF and ePub downloads, according to the available data) and Abstracts Views on Vision4Press platform.
Data correspond to usage on the plateform after 2015. The current usage metrics is available 48-96 hours after online publication and is updated daily on week days.
Initial download of the metrics may take a while.