Fig. 7.
Download original image
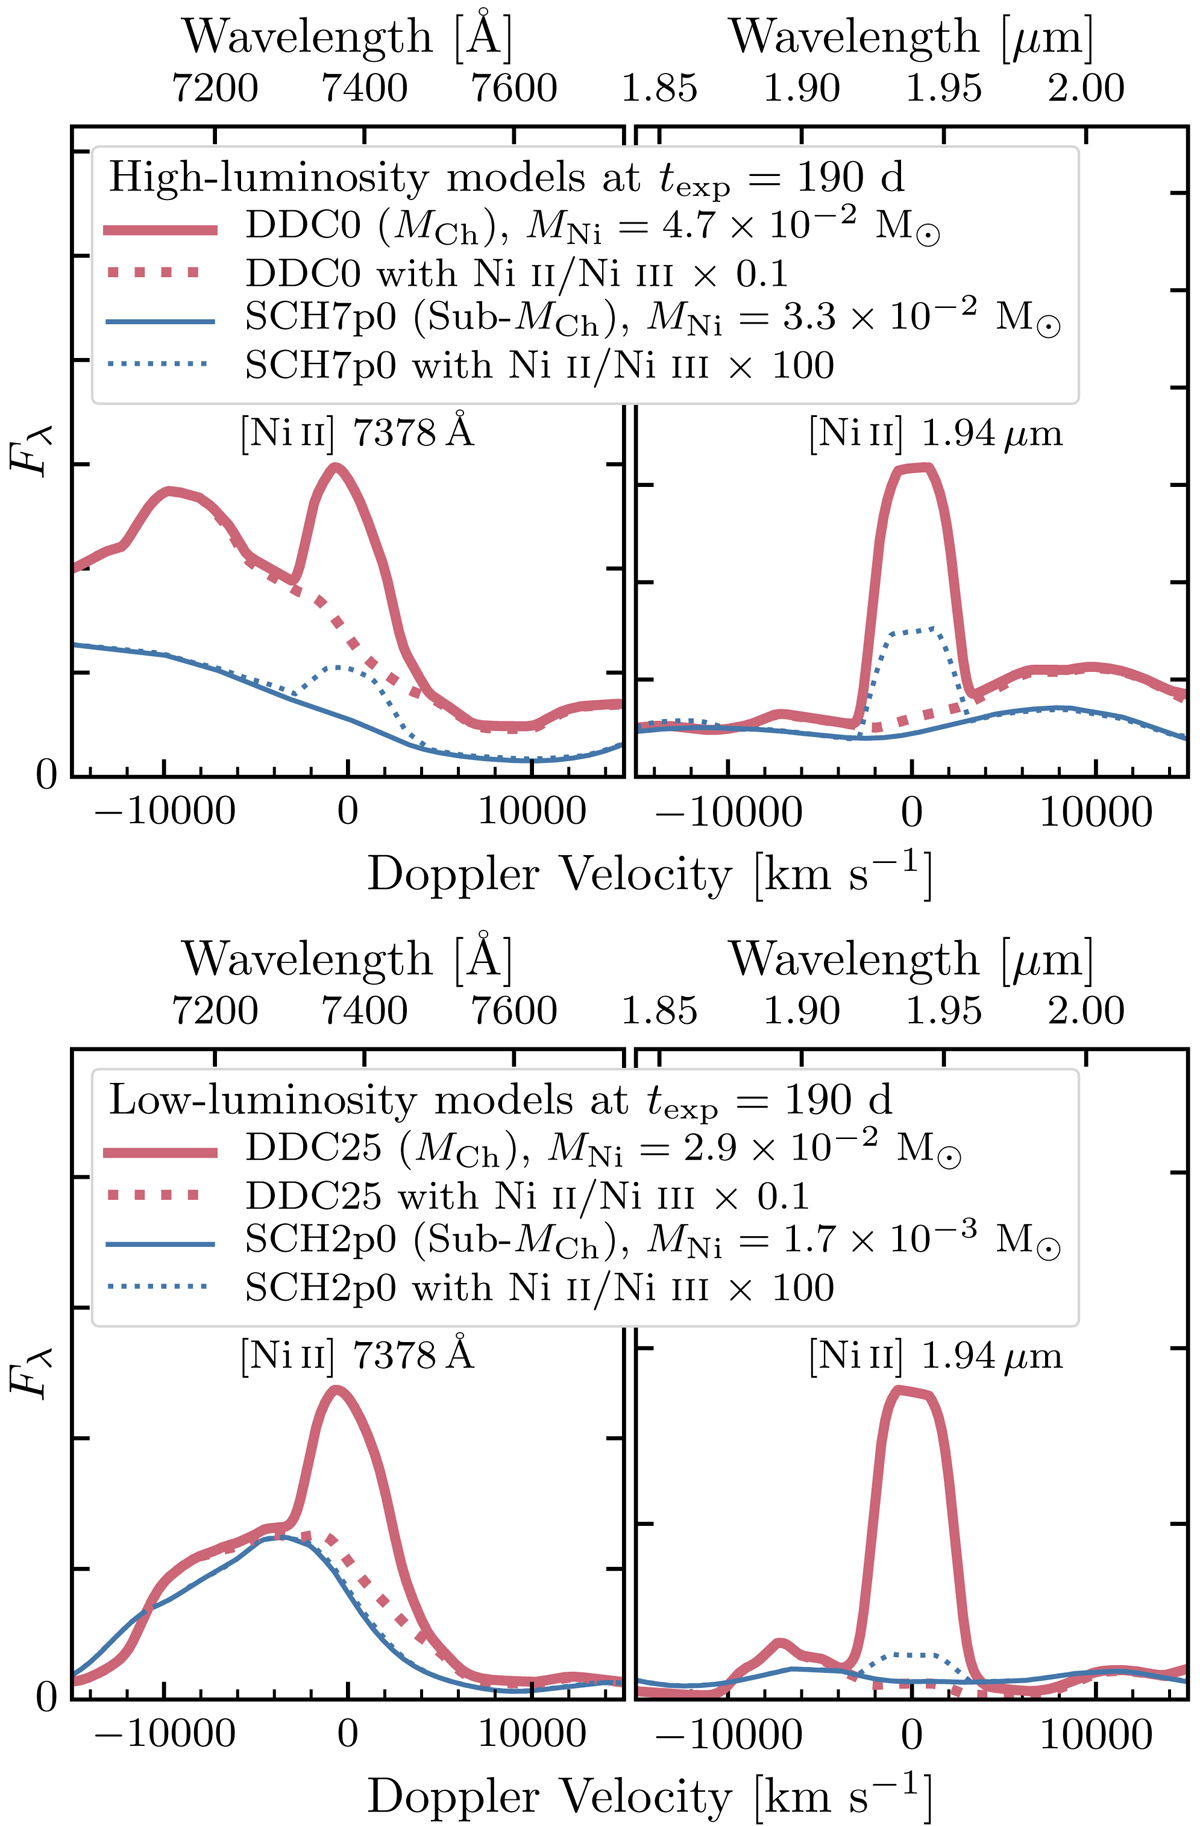
Top panel: optical (left) and near-infrared (right) [Ni II] line profiles at 190 d past explosion in the high-luminosity models DDC0 (MCh; thick solid line) and SCH7p0 (sub-MCh; thin solid line). The dotted lines show the impact of artificially decreasing (increasing) the Ni II/Ni III ratio on the emergence of [Ni II] lines in the MCh (sub-MCh) model. The near-infrared (NIR) line profiles were normalized to the same mean flux in the range 1.87−1.88 μm; the optical profiles are not normalized. Bottom panel: same as above for the low-luminosity models DDC25 (MCh; thick solid line) and SCH2p0 (sub-MCh; thin solid line). We note the absence of an optical [Ni II] 7378 Å line in the sub-MCh model with high Ni II/Ni III ratio see text for details).
Current usage metrics show cumulative count of Article Views (full-text article views including HTML views, PDF and ePub downloads, according to the available data) and Abstracts Views on Vision4Press platform.
Data correspond to usage on the plateform after 2015. The current usage metrics is available 48-96 hours after online publication and is updated daily on week days.
Initial download of the metrics may take a while.