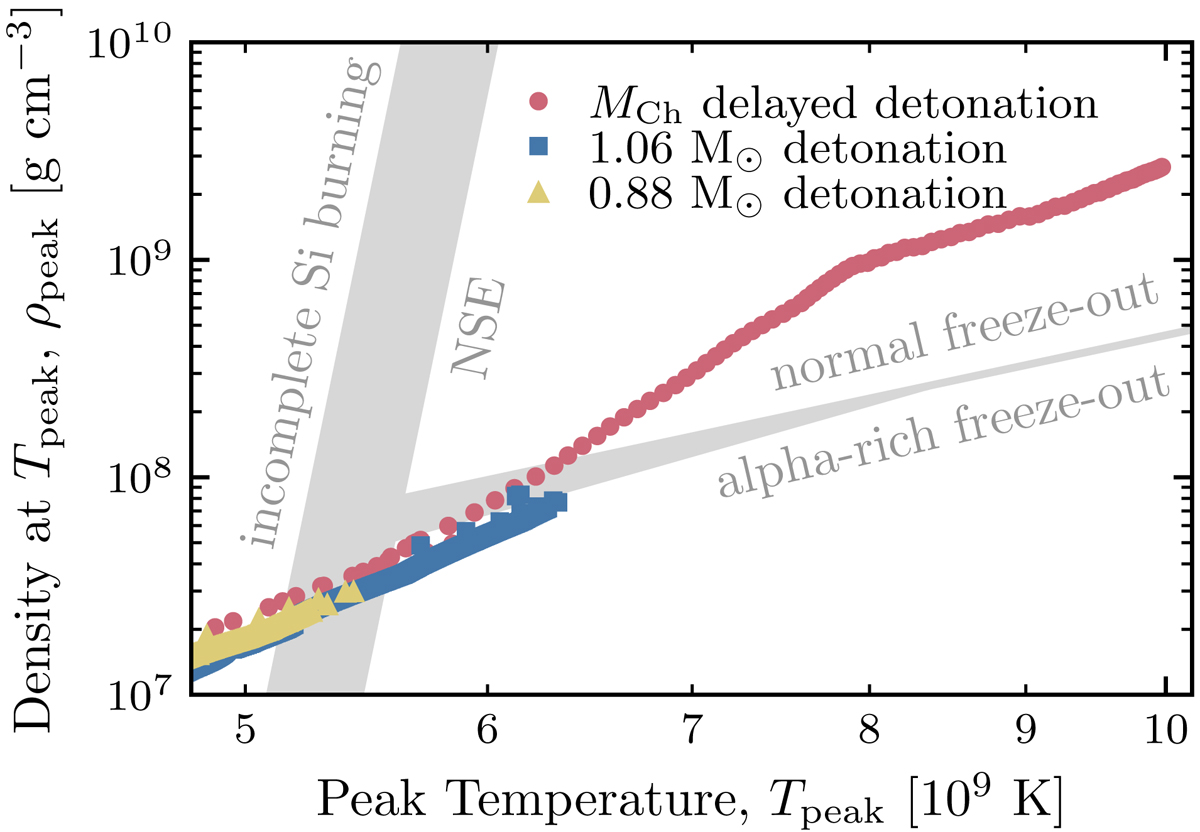
Fig. 1.
Download original image
Density at peak temperature (ρpeak) versus peak temperature (Tpeak, in units of 109 K) in the MCh delayed-detonation model 5p0_Z0p014 (filled circles) and the sub-MCh detonation models 1p06_Z2p25e-2 (MWD = 1.06 M⊙, filled squares) and 0p88_Z2p25e-2 (MWD = 0.88 M⊙, filled triangles). The wide vertical band denotes the transition between incomplete Si burning and complete burning to NSE. The NSE region is further subdivided into ‘normal’ and ‘alpha-rich’ freeze-out regimes. The width of the bands correspond to variations in the post-burn cooling time scale (Woosley et al. 1973; see also Lach et al. 2020, their Fig. 1).
Current usage metrics show cumulative count of Article Views (full-text article views including HTML views, PDF and ePub downloads, according to the available data) and Abstracts Views on Vision4Press platform.
Data correspond to usage on the plateform after 2015. The current usage metrics is available 48-96 hours after online publication and is updated daily on week days.
Initial download of the metrics may take a while.