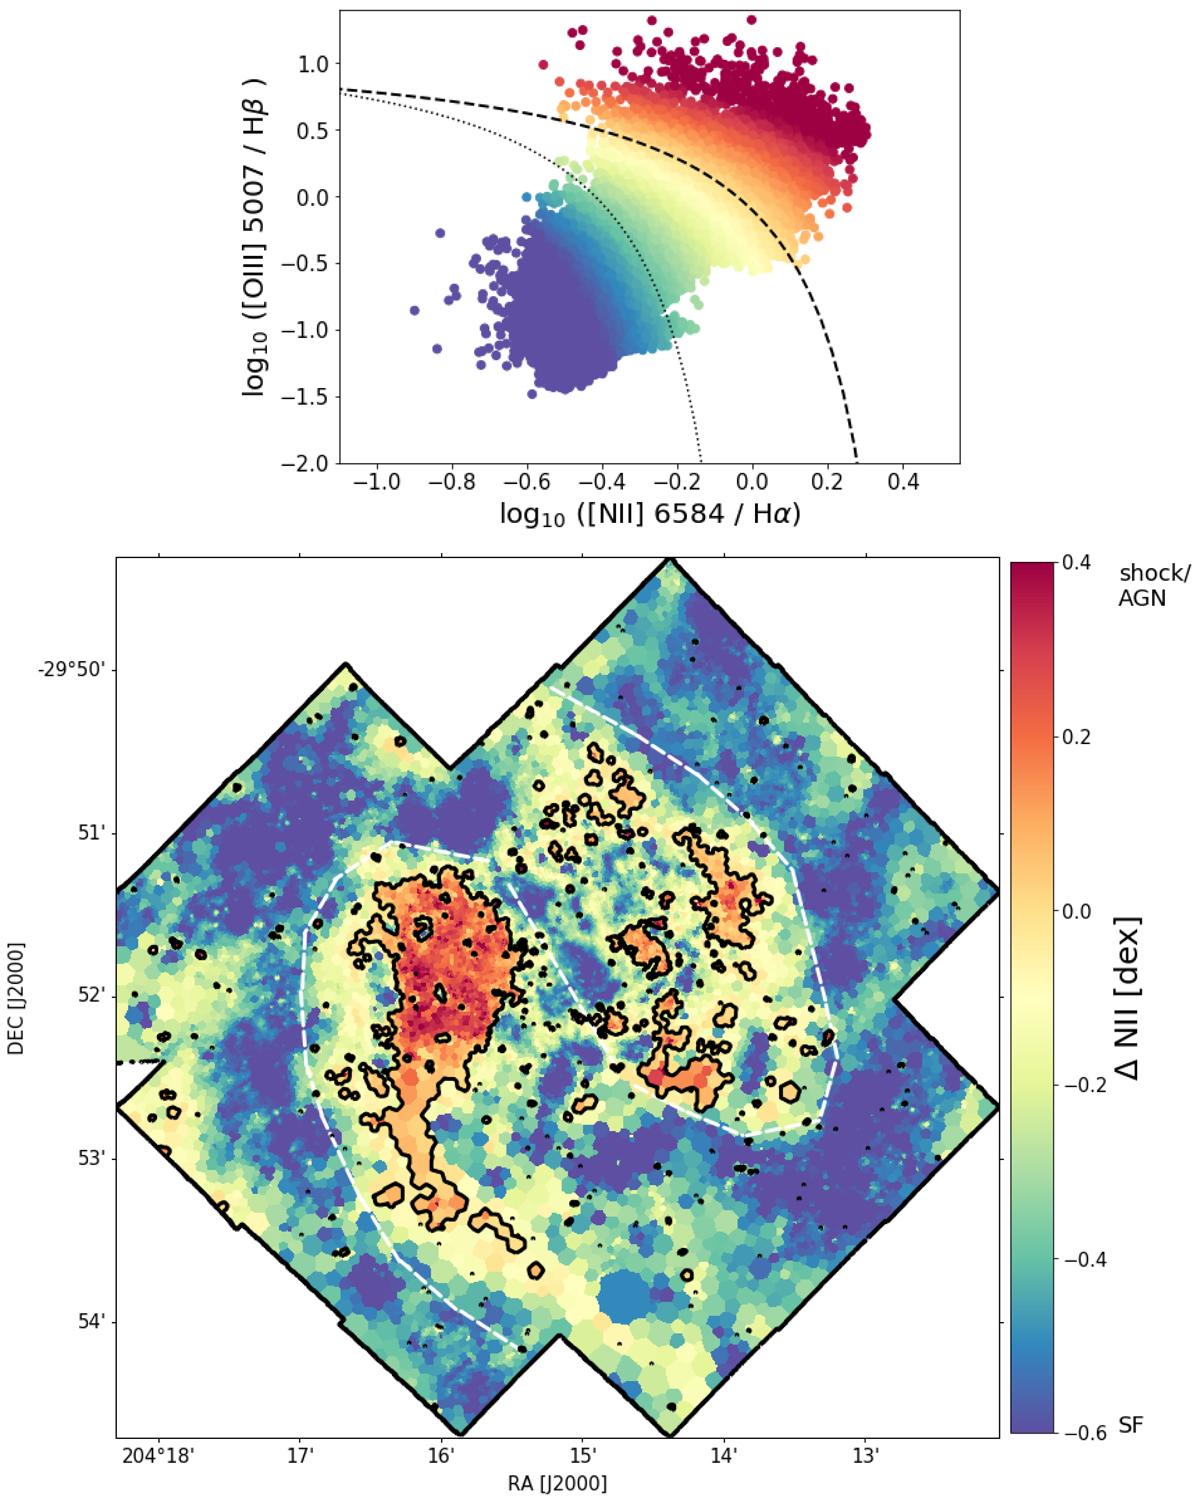
Fig. 9.
Download original image
1D (top panel) and 2D (bottom panel) N II-BPT diagram, with each point colour coded according to its distance from the extreme starburst line of Kewley et al. (2001, black dashed line in the top panel). The distance (Δ N II), ranges from dark blue for pure SF to red for pure shock or AGN emission. In the top panel, we also show the empirical demarcation line from Kauffmann et al. (2003, black dotted line), indicating a more stringent limit for photoionised gas. In the bottom panel, the black contours correspond to Δ N II = 0 and white dashed lines indicate the position of the bar and spiral arms.
Current usage metrics show cumulative count of Article Views (full-text article views including HTML views, PDF and ePub downloads, according to the available data) and Abstracts Views on Vision4Press platform.
Data correspond to usage on the plateform after 2015. The current usage metrics is available 48-96 hours after online publication and is updated daily on week days.
Initial download of the metrics may take a while.