Fig. 6.
Download original image
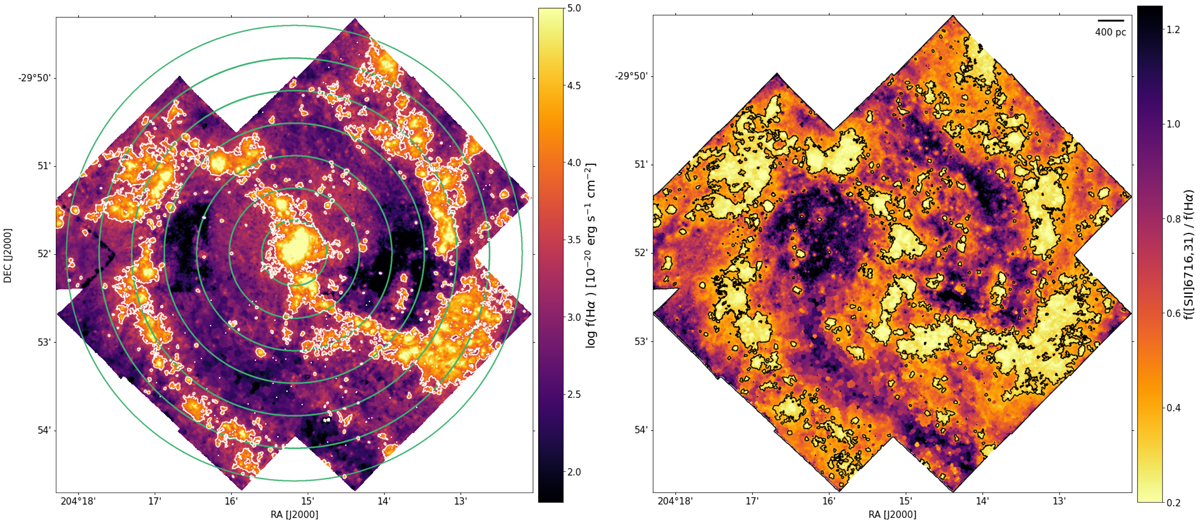
Maps of Hα (left panel) and [S II] λ6716,31/Hα (right panel) emission. Both maps have been corrected for extinction and deprojected. The contours indicate the outer limit of star-forming regions and correspond, respectively, to a cut in SBHα = 1.23 × 10⁻¹⁵ erg s−1 cm−2 arcsec−2 and [S II]/Hα = 0.29. In green we indicate the annular sectors for which we compute the radial trends in Fig. 7.
Current usage metrics show cumulative count of Article Views (full-text article views including HTML views, PDF and ePub downloads, according to the available data) and Abstracts Views on Vision4Press platform.
Data correspond to usage on the plateform after 2015. The current usage metrics is available 48-96 hours after online publication and is updated daily on week days.
Initial download of the metrics may take a while.