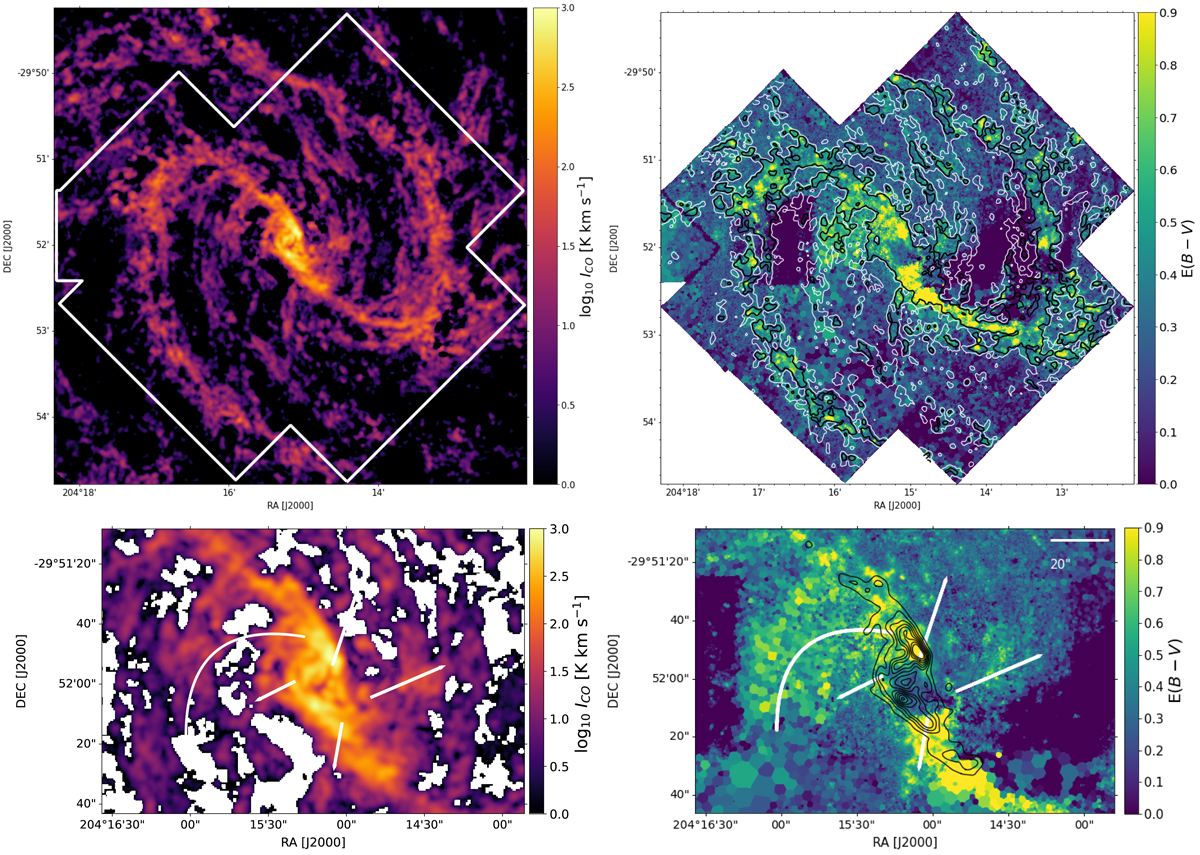
Fig. 5.
Download original image
Extinction traced by the ALMA and MUSE data. Left panels: CO(2-1) molecular gas emission from ALMA. Right panels: extinction map derived from the MUSE Hβ/Hα ratio. Bottom panels: zoom-in into the central region, where the white lines mark the position of the features discussed in Sect. 6. The contours in the top right panel indicate CO(2-1) emission at 5 (white) and 15 (black) K km s−1 (corresponding to Σmol ∼ 30 and 100 M⊙ pc−2); the black contours in the bottom right panel range from 90 to 800 K km s−1 in steps of ∼90 (corresponding to Σmol ∼ 600−5350 M⊙ pc−2).
Current usage metrics show cumulative count of Article Views (full-text article views including HTML views, PDF and ePub downloads, according to the available data) and Abstracts Views on Vision4Press platform.
Data correspond to usage on the plateform after 2015. The current usage metrics is available 48-96 hours after online publication and is updated daily on week days.
Initial download of the metrics may take a while.