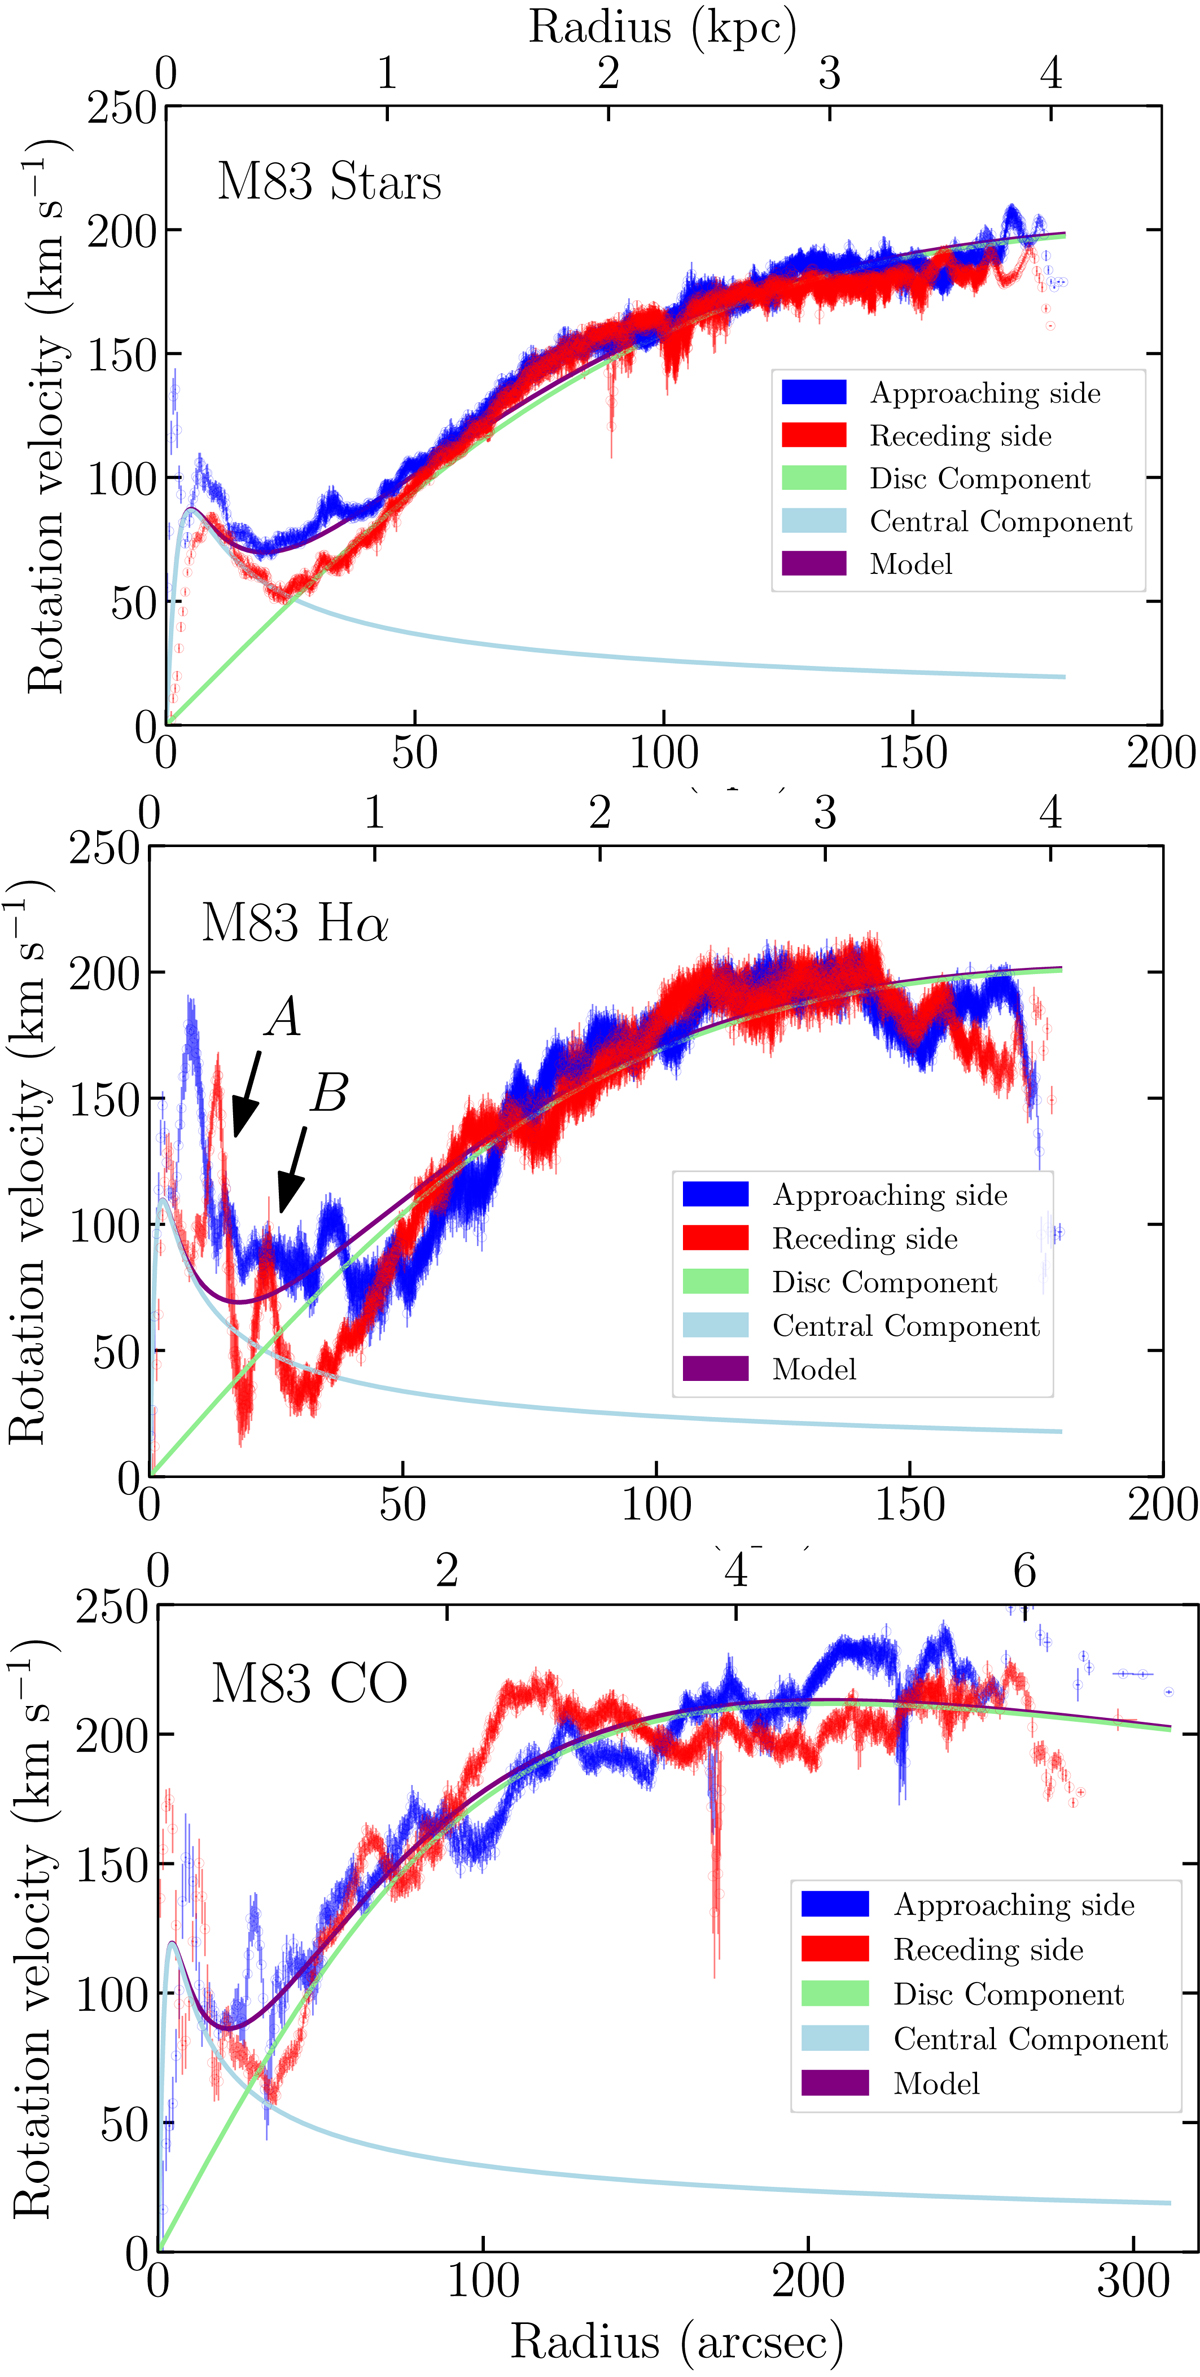
Fig. 4.
Download original image
Rotation curves for the stellar (top), Hα (centre) and CO (bottom) velocity fields (models (A), (d) and (γ) in Table 2). We remark on the larger radial extent of the CO data on the bottom plot. The contributions of the two best-fit Plummer components – modelling the galactic and circumnuclear disk – are shown in cyan and light green, and the sum of their contributions in purple. The red and blue curves correspond to the receding and approaching side of the velocity map. In Fig. A.1, we additionally show the Hα rotation curve for model (e), where we enforce a more symmetrical curve. In the middle panel, the radial location of features A and B discussed in Sect. 6.1 is indicated.
Current usage metrics show cumulative count of Article Views (full-text article views including HTML views, PDF and ePub downloads, according to the available data) and Abstracts Views on Vision4Press platform.
Data correspond to usage on the plateform after 2015. The current usage metrics is available 48-96 hours after online publication and is updated daily on week days.
Initial download of the metrics may take a while.