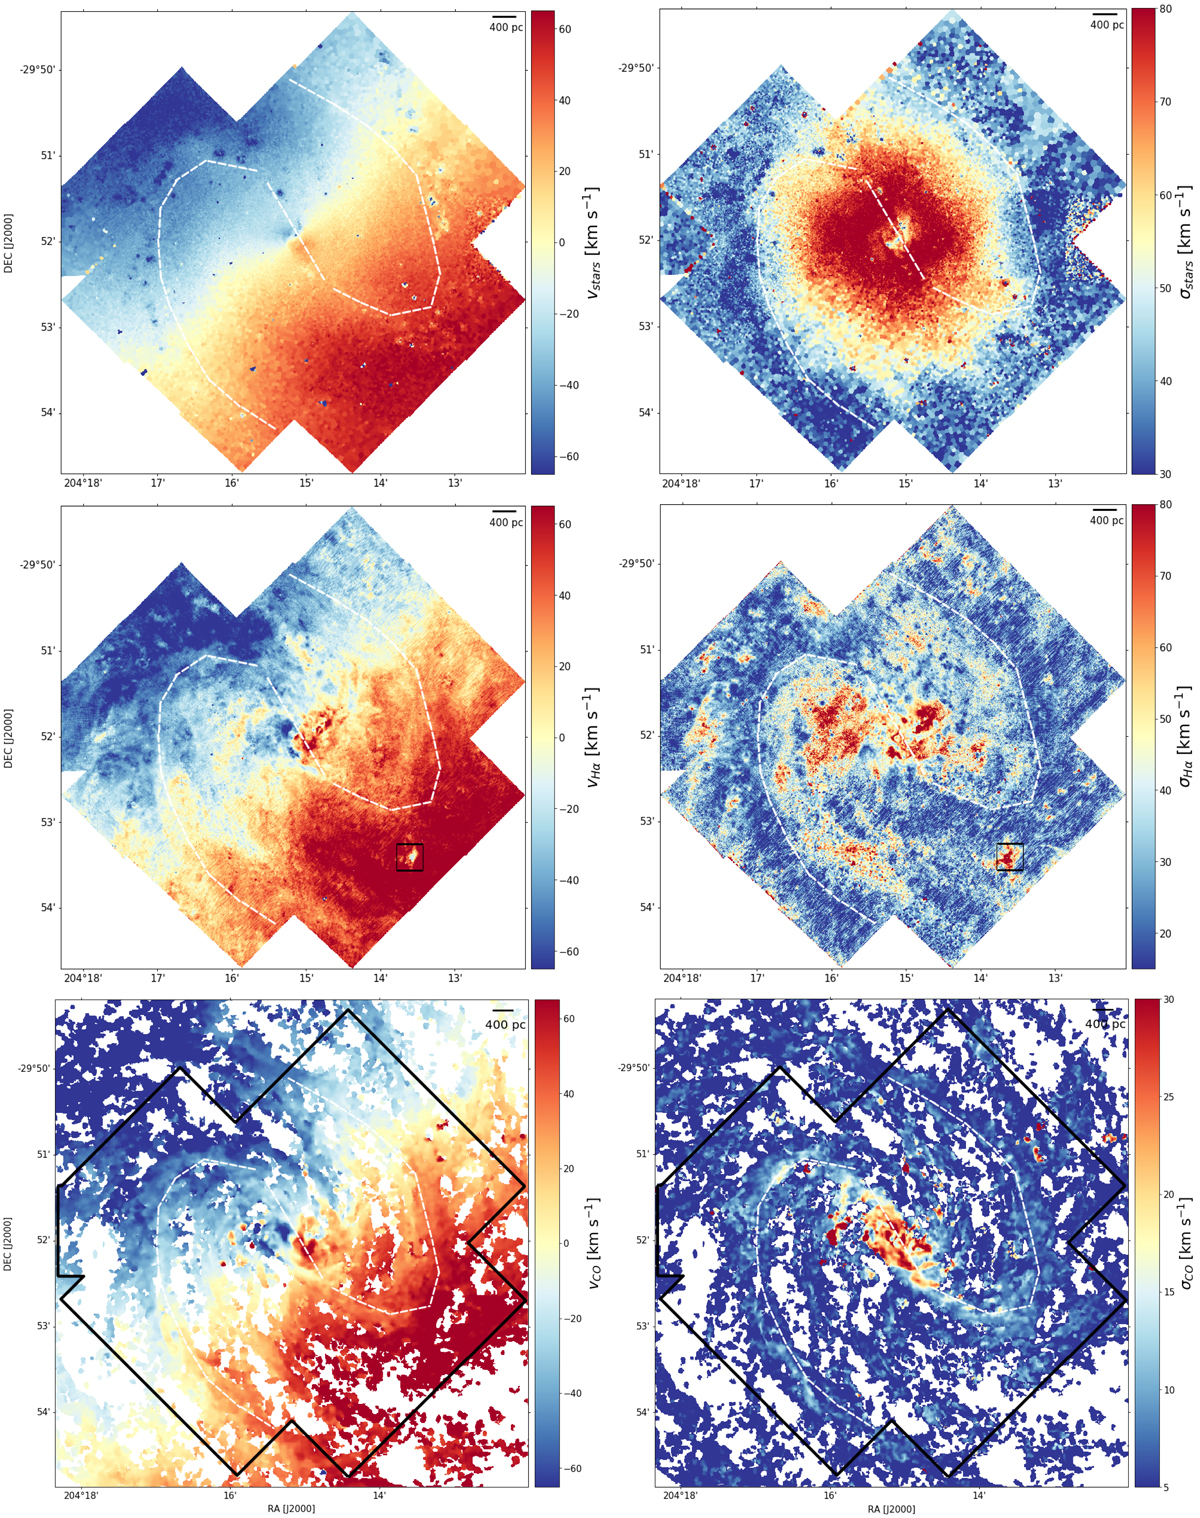
Fig. 3.
Download original image
Kinematics of the stars and gas. Top row: MUSE stellar kinematics. Centre row: MUSE Hα kinematics. The black box in the bottom right corner indicates the position of what we interpret as an extraplanar Hα cloud. Bottom row: molecular gas kinematics from ALMA CO(2-1) (mom1 and mom2 maps). The footprint of the MUSE data is overlaid in black. All velocity maps have been corrected for systemic velocity; no inclination correction has been applied. The velocity dispersion maps refer to the intrinsic dispersion (instrumental effects have been removed). The white dashed lines sketch the position of the bar and spiral arms as shown in Fig. 1 (see Sect. 1). A zoom-in into the central kinematics is shown in Fig. 11.
Current usage metrics show cumulative count of Article Views (full-text article views including HTML views, PDF and ePub downloads, according to the available data) and Abstracts Views on Vision4Press platform.
Data correspond to usage on the plateform after 2015. The current usage metrics is available 48-96 hours after online publication and is updated daily on week days.
Initial download of the metrics may take a while.