Free Access
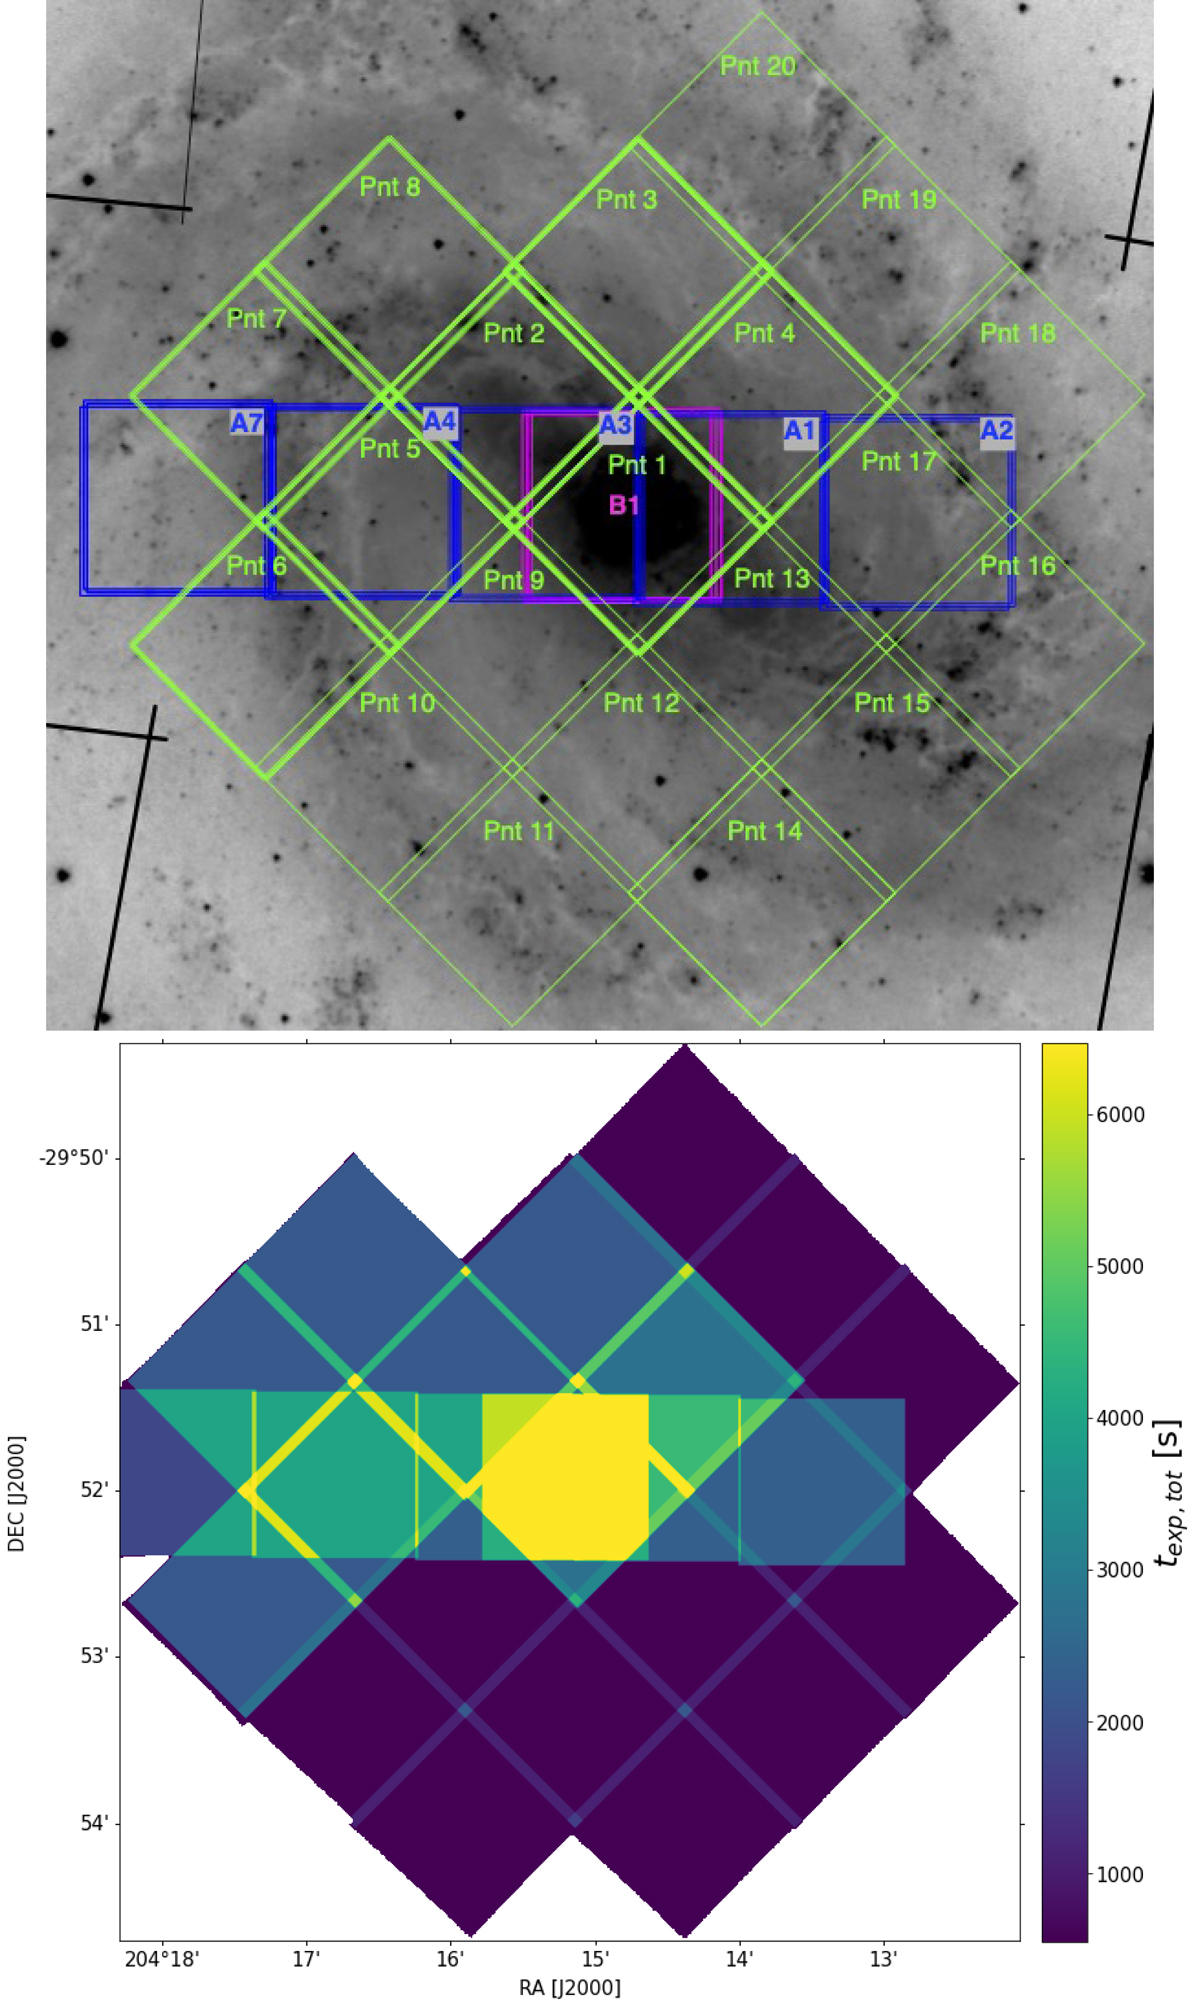
Fig. C.1.
Download original image
Layout of the MUSE mosaic. Top panel: location of the MUSE mosaic tiles. In green we indicate the data acquired as part of this project (PI Adamo); in blue and purple archival data that we have included in the final mosaic (PI Ibar and Gadotti). Bottom panel: total exposure time of each mosaic tile.
Current usage metrics show cumulative count of Article Views (full-text article views including HTML views, PDF and ePub downloads, according to the available data) and Abstracts Views on Vision4Press platform.
Data correspond to usage on the plateform after 2015. The current usage metrics is available 48-96 hours after online publication and is updated daily on week days.
Initial download of the metrics may take a while.