Fig. 2.
Download original image
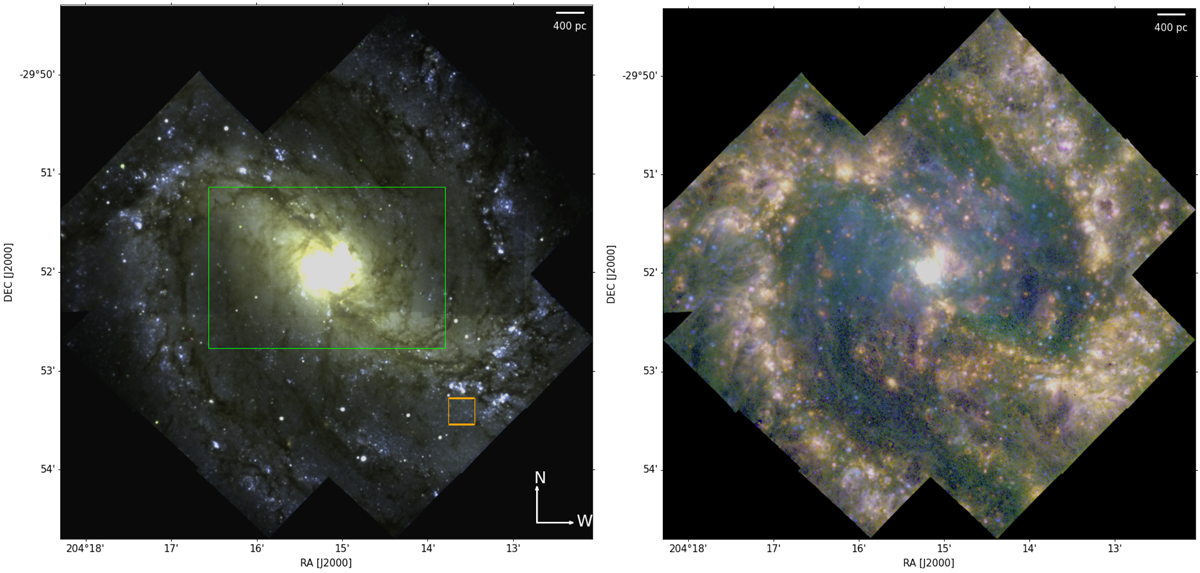
Three-colour composites of the MUSE data. Left: composite of stellar bands (Blue: 4875–4950 Å, Green: 6520–6528 Å, Red: 6750–6810 Å). The green rectangle indicates the central starburst region analysed in Sect. 6. The orange square indicates the position of the Hα cloud highlighted in Fig. 3 (central panels). Right: composite of gas emission (Blue: [O III], Green: [S II] Red: Hα).
Current usage metrics show cumulative count of Article Views (full-text article views including HTML views, PDF and ePub downloads, according to the available data) and Abstracts Views on Vision4Press platform.
Data correspond to usage on the plateform after 2015. The current usage metrics is available 48-96 hours after online publication and is updated daily on week days.
Initial download of the metrics may take a while.