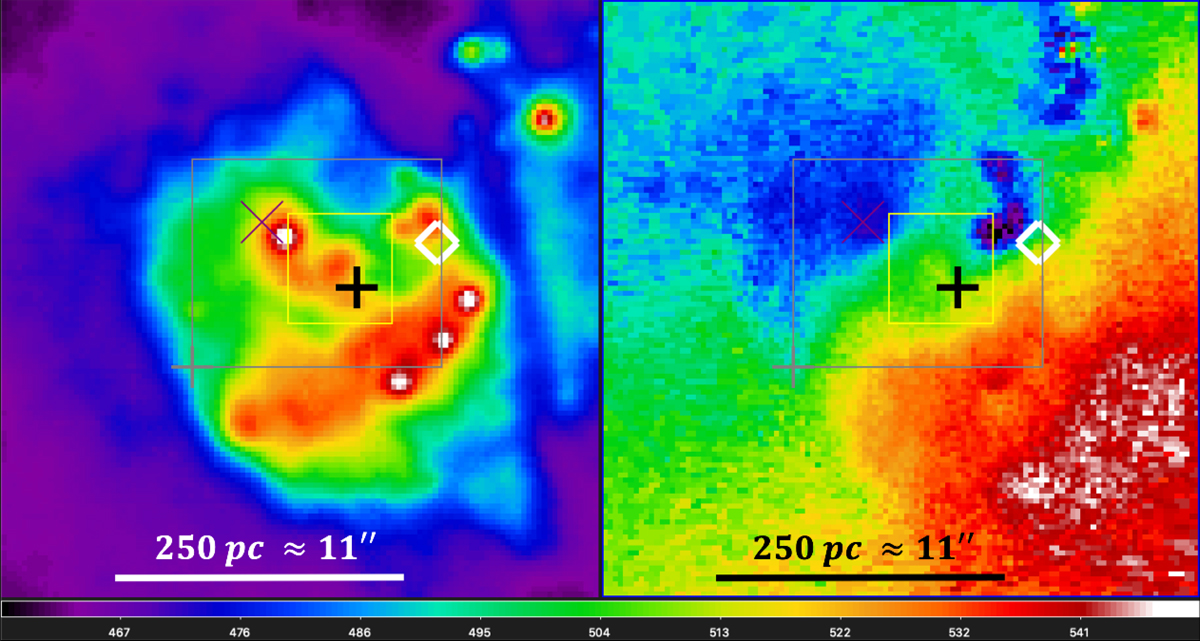
Fig. A.3.
Download original image
Different centre positions from this work and the literature. Boxes indicate uncertainty determinations from centres as calculated by other authors. The background images show: continuum emission around the Hα line, rescaled in intensity (left panel, arbitrary units) and the observed stellar velocity field (right panel and horizontal colour bar, not corrected for the systemic velocity). The coordinates of the symbols and the box centres are given in Table A.1. Yellow box (Fabry-Perot kinematic centre, Fathi et al. 2008, Knapen et al. 2010, size of the box: 4.0×4.2 arcsec2); grey box (Pa β kinematic centre, Knapen et al. 2010, size of the box: 9.6×8.0 arcsec2); grey ” (corner of the Pa β uncertainty box that is the furthest away from the centre determined using the MUSE stellar velocity map); purple ” (optical nucleus, Díaz et al. 2006); white ” (MUSE stellar kinematic centre from model (A), this work); black ” (CO kinematic centre from model (β), this work).
Current usage metrics show cumulative count of Article Views (full-text article views including HTML views, PDF and ePub downloads, according to the available data) and Abstracts Views on Vision4Press platform.
Data correspond to usage on the plateform after 2015. The current usage metrics is available 48-96 hours after online publication and is updated daily on week days.
Initial download of the metrics may take a while.