Fig. 16.
Download original image
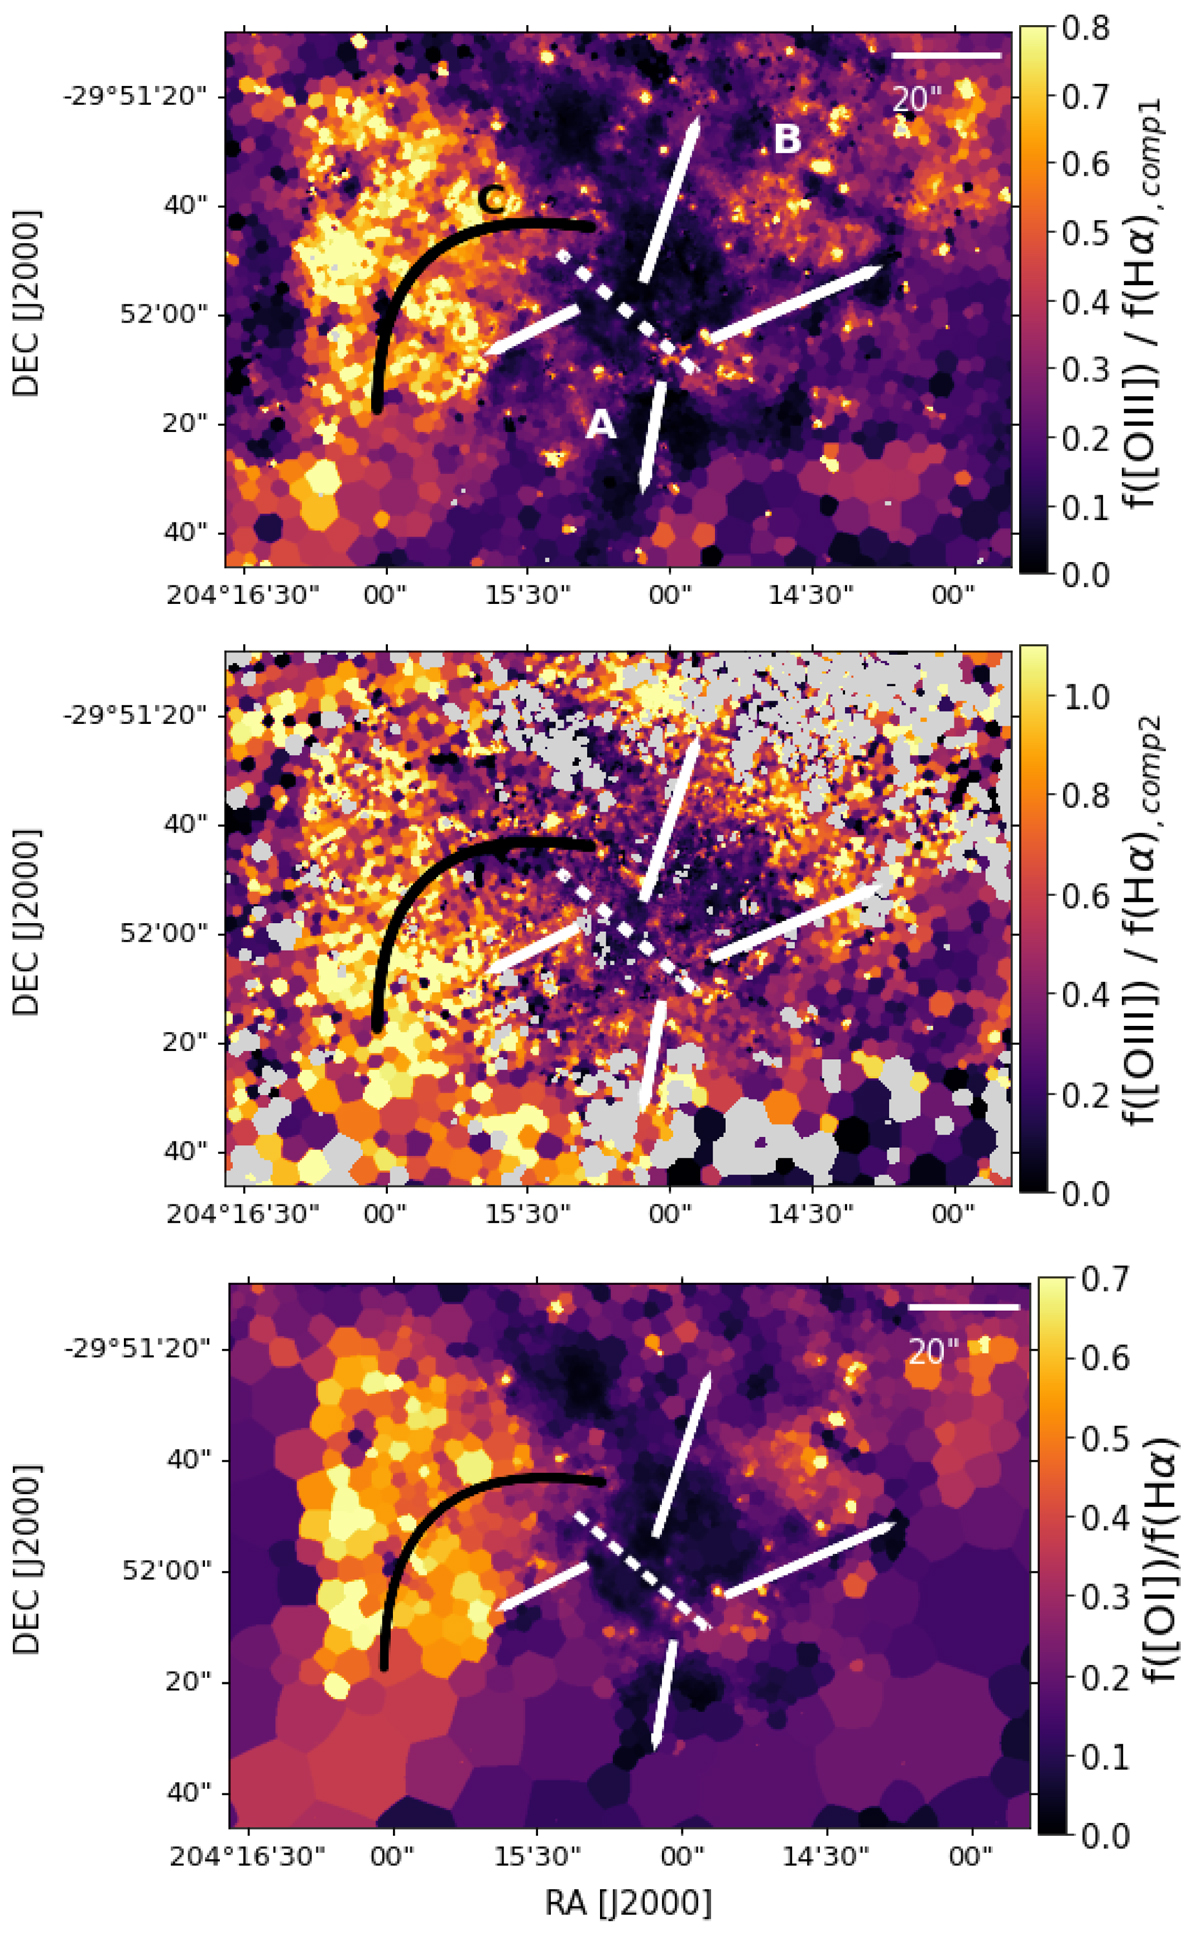
Ratios of strong emission lines observed with MUSE. Top and centre: map of [O III] λ4959,5007/Hα obtained from a double component Gaussian fit to the emission lines. Bottom panel: map of [O I] λ6300/Hα obtained from a single Gaussian component fit. All maps have been corrected for extinction. The labelled features are discussed in Sect. 6.3. Maps of the full FoV are shown in Fig. B.2.
Current usage metrics show cumulative count of Article Views (full-text article views including HTML views, PDF and ePub downloads, according to the available data) and Abstracts Views on Vision4Press platform.
Data correspond to usage on the plateform after 2015. The current usage metrics is available 48-96 hours after online publication and is updated daily on week days.
Initial download of the metrics may take a while.