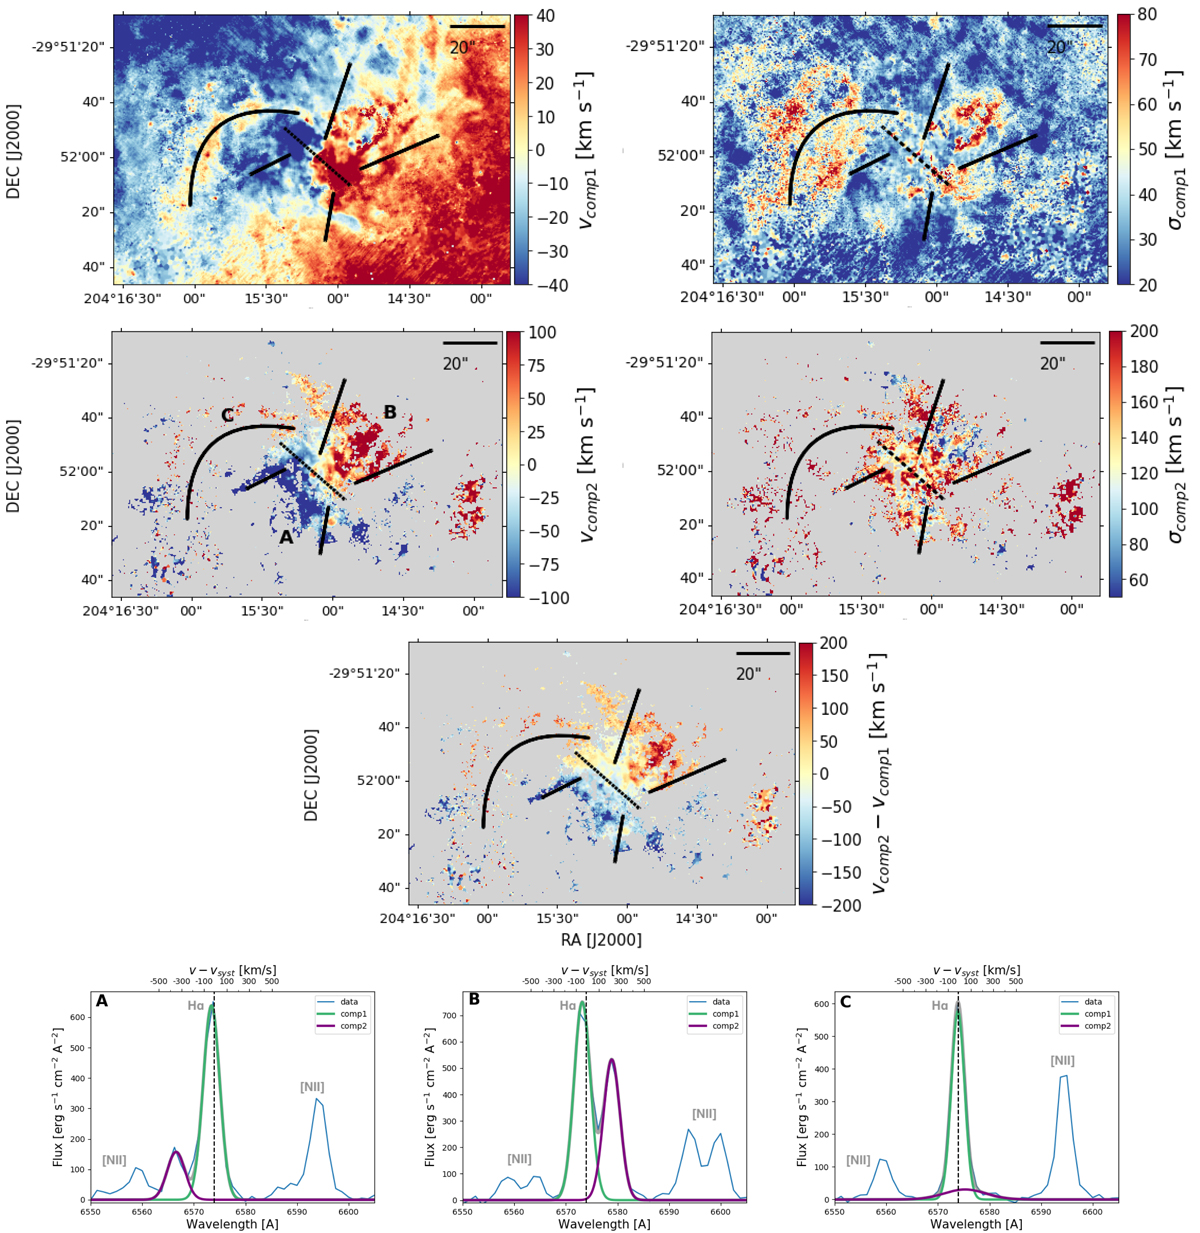
Fig. 12.
Download original image
Results from the 2-component Gaussian fit to the Hα line. First and second row: Hα velocity (left panels) and velocity dispersion (right panels) maps, of the two components. The velocity maps have been corrected for the systemic velocity; no inclination correction has been applied. The velocity dispersion has been corrected for instrumental effects. We draw attention on the different velocity and dispersion scales spanned by the first and second component. Third row: velocity difference between the two components (blue and red indicate, respectively, a second component that is more strongly blueshifted and redshifted with respect to the first one). Black lines mark the kinematic features discussed in Sect. 6. Bottom row: typical spectra of features A and B and C (see labels in the figure). In panels A and B, both the Hα line and the [N II] doublet are clearly doubly peaked, with Δv ∼ 300 km s−1. In panel C, both components are at similar velocity, but the second component has an extremely high σ ∼ 140 km s−1.
Current usage metrics show cumulative count of Article Views (full-text article views including HTML views, PDF and ePub downloads, according to the available data) and Abstracts Views on Vision4Press platform.
Data correspond to usage on the plateform after 2015. The current usage metrics is available 48-96 hours after online publication and is updated daily on week days.
Initial download of the metrics may take a while.