Fig. 3.
Download original image
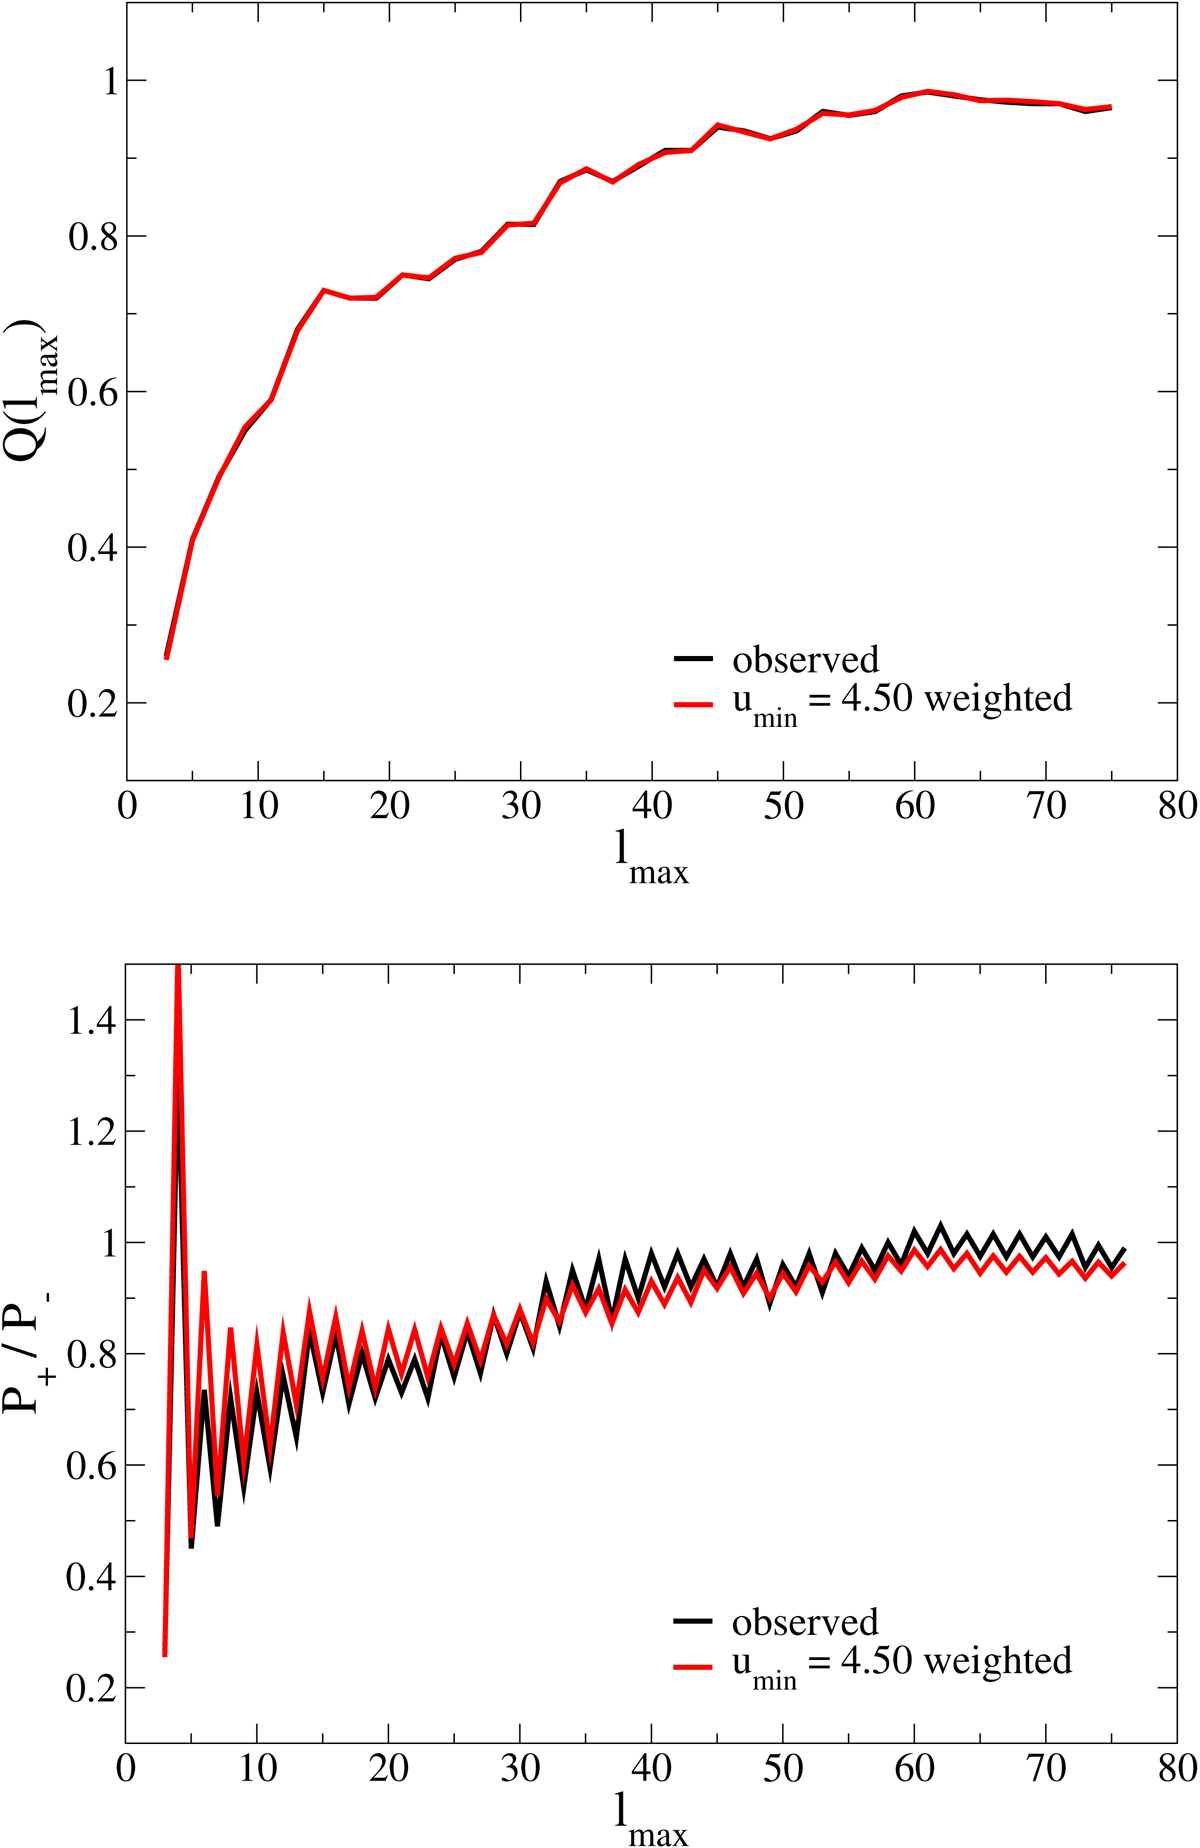
Statistics used to describe the point-parity asymmetry of the CMB. (a) Top panel: ![]() statistic as a function of ℓmax for umin = 4.50 (red), compared to the Planck 2018 data. The overlap is visually almost perfect. (b) Bottom panel: same for the P(ℓmax) statistic using the values of Cℓ determined from the matching of the
statistic as a function of ℓmax for umin = 4.50 (red), compared to the Planck 2018 data. The overlap is visually almost perfect. (b) Bottom panel: same for the P(ℓmax) statistic using the values of Cℓ determined from the matching of the ![]() statistic with the data shown on the left. The reduced χ2 for this fit is
statistic with the data shown on the left. The reduced χ2 for this fit is ![]() .
.
Current usage metrics show cumulative count of Article Views (full-text article views including HTML views, PDF and ePub downloads, according to the available data) and Abstracts Views on Vision4Press platform.
Data correspond to usage on the plateform after 2015. The current usage metrics is available 48-96 hours after online publication and is updated daily on week days.
Initial download of the metrics may take a while.