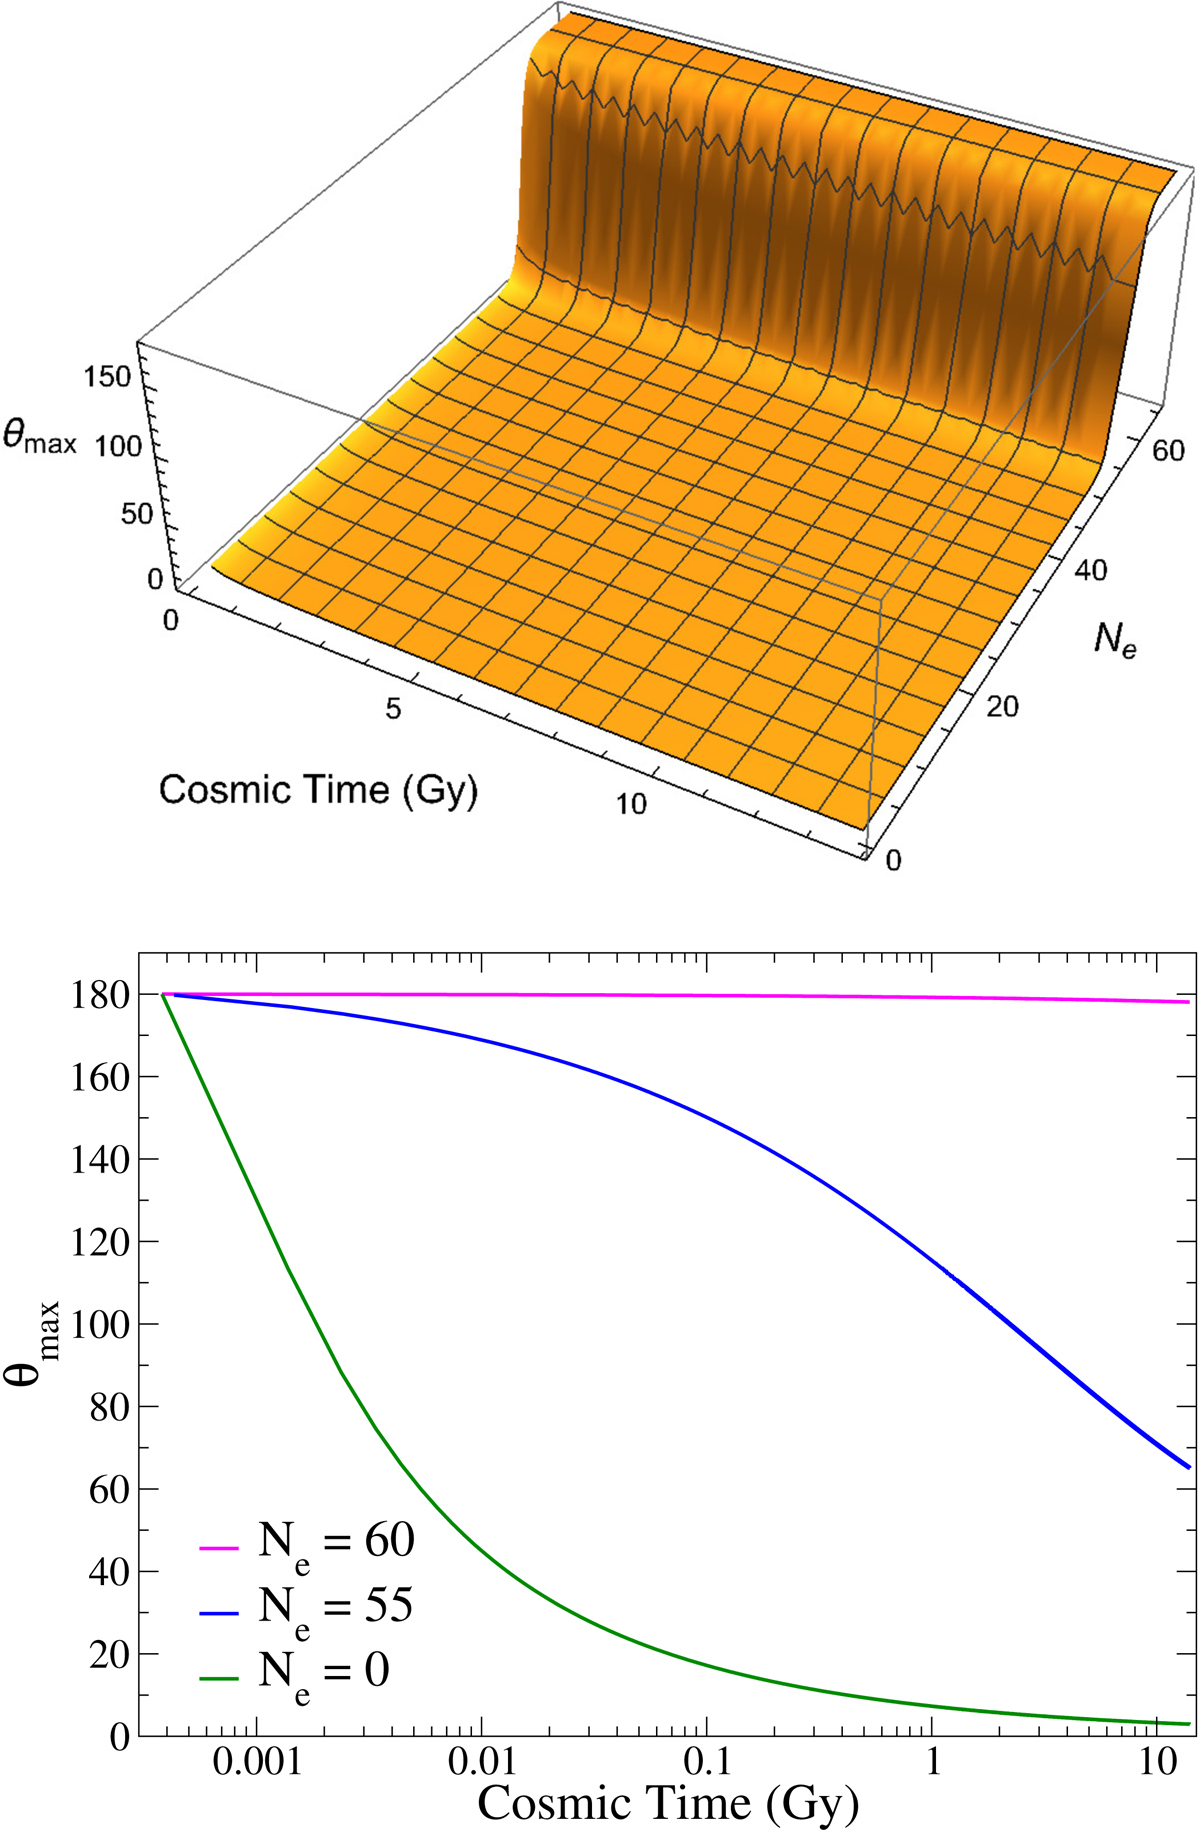
Fig. 2.
Download original image
Maximum correlation angle due to inflation. Top panel (a): 3D plot of the maximum correlation angle as a function of cosmic time and the number of e-folds. Bottom panel (b): maximum correlation angle evolution with cosmic time for different Ne values, corresponding to vertical sections in the 3D plot. We highlight that the plateau for Ne is smaller than about 50, implying a large inhomogeneity of the CMB along cosmic time.
Current usage metrics show cumulative count of Article Views (full-text article views including HTML views, PDF and ePub downloads, according to the available data) and Abstracts Views on Vision4Press platform.
Data correspond to usage on the plateform after 2015. The current usage metrics is available 48-96 hours after online publication and is updated daily on week days.
Initial download of the metrics may take a while.